UNITED STATES
SECURITIES AND EXCHANGE COMMISSION
Washington D.C. 20549
SCHEDULE 14A
Proxy Statement Pursuant to Section 14(a) of the
Securities
Exchange Act of 1934 (Amendment No. )
Filed by the Registrant ☑
Check the appropriate box:
| Preliminary Proxy Statement | ||
| ☐ | Confidential, for Use of the Commission Only (as permitted by Rule 14a-6(e)(2)) | |
| ☐ | Definitive Proxy Statement | |
| ☐ | Definitive Additional Materials | |
| ☐ | Soliciting Material | |
THE KROGER CO.
(Name of Registrant as Specified in Its Charter)
(Name of Person(s) Filing Proxy Statement, if other than the Registrant)
Payment of Filing Fee (Check the appropriate box):
| No fee required. | |||||||
| ☐ | Fee computed on table below per Exchange Act Rules 14a-6(i) | ||||||
| a. | Title of each class of securities to which transaction applies: | ||||||
Aggregate number of securities to which transaction applies: | |||||||
| c. | |||||||
Per unit price or other underlying value of transaction computed pursuant to Exchange Act Rule 0-11 | |||||||
| d. | |||||||
Proposed maximum aggregate value of transaction: | |||||||
| e. | Total fee paid: | ||||||
| Fee paid previously with preliminary materials. | |||||||
| Check box if any part of the fee is offset as provided by Exchange Act Rule 0-11(a)(2) and identify the filing for which the offsetting fee was paid previously. Identify the previous filing by registration statement number, or the Form or Schedule and the date of its filing. | |||||||
| a. | Amount | ||||||
Form, Schedule or Registration Statement No.: | |||||||
Filing | |||||||
| party: | |||||||
Date Filed: | |||||||

Notice of 20162018 Annual Meeting of Shareholders
Fellow Kroger Shareholders:
It is our pleasure to invite you to join our Board of Directors, senior leadership, and other Kroger associates at The Kroger Co. Annual Meeting of Shareholders.
| When: | Thursday, June | |||
| Where: | ||||
Music Hall Music Hall Ballroom 1241 Elm Street Cincinnati, OH 45202 | ||||
| Items of Business: | 1. | To elect | ||
2. | To approve our executive compensation, on an advisory basis. | |||
3. | To approve an amendment to our Regulations to adopt proxy access. 4. To approve an amendment to our Regulations to permit Board amendments in accordance with Ohio law. 5. To ratify the selection of our independent auditor for fiscal year | |||
| 2018. 6. To vote on | ||||
7. To transact other business as may properly come before the meeting. | ||||
| Who can Vote: | Holders of Kroger common shares at the close of business on the record date | |||
| How to Vote: | Your vote is important! Please vote your proxy in one of the following ways: | |||
1. | Via the internet, by visiting www.proxyvote.com. | |||
2. | By telephone, by calling the number on your proxy card, voting instruction form or notice. | |||
3. | By mail, by marking, signing, dating and mailing your proxy card if you requested printed materials, or your voting instruction form. No postage is required if mailed in the United States. | |||
4. | In person, by attending the meeting in Cincinnati. | |||
| Attending the Meeting: | Shareholders holding shares at the close of business on the record date, or their duly appointed proxies, may attend the meeting. If you plan to attend the meeting, you must bring either: (1) the notice of meeting that was separately mailed to you or (2) the top portion of your proxy card, either of which will be your admission ticket. You must also bring valid photo identification, such as a driver’s license or passport. We reserve the right to exclude any person who cannot provide an admission ticket and valid photo identification. | |||
| Webcast of the Meeting: | If you are unable to attend the meeting, you may listen to a live webcast of the meeting by visiting ir.kroger.com at 11:00 a.m. eastern time on June | |||
We appreciate your continued confidence in Kroger, and we look forward to seeing you at the meeting.
| May , 2018 | By Order of the Board of Directors, | |
| Cincinnati, Ohio | Christine S. Wheatley, Secretary | |
Proxy Statement
May 12, 2016, 2018
We are providing this notice, proxy statement and annual report to the shareholders of The Kroger Co. (“Kroger”, “we”, “us”, “our”) in connection with the solicitation of proxies by the Board of Directors of Kroger (the “Board”) for use at the Annual Meeting of Shareholders to be held on June 23, 2016,28, 2018, at 11:00 a.m. eastern time, at the School for Creative and Performing Arts, Corbett Theater, 108 W. Central Parkway,Music Hall Ballroom, Music Hall, 1241 Elm St., Cincinnati, Ohio 45202, and at any adjournments thereof.
Our principal executive offices are located at 1014 Vine Street, Cincinnati, Ohio 45202-1100. Our telephone number is513-762-4000. This notice, proxy statement and annual report, and the accompanying proxy card were first furnished to shareholders on May 12, 2016., 2018.
Who can vote?
You can vote if, as of the close of business on April 27, 2016,May 2, 2018, you were a shareholder of record of Kroger common shares.
Who is asking for my vote, and who pays for this proxy solicitation?
Your proxy is being solicited by Kroger’s Board of Directors. Kroger is paying the cost of solicitation. We have hired D.F. King & Co., Inc., 48 Wall Street, New York, New York, a proxy solicitation firm, to assist us in soliciting proxies and we will pay them a fee estimated not to exceed $15,000.$17,500.
We also will reimburse banks, brokers, nominees, and other fiduciaries for postage and reasonable expenses incurred by them in forwarding the proxy material to beneficial owners of our common shares.
Proxies may be solicited personally, by telephone, electronically via the Internet, or by mail.
Who are the members of the Proxy Committee?
Robert D. Beyer, W. Rodney McMullen, and Ronald L. Sargent, all Kroger Directors, are the members of the Proxy Committee for our 20162018 Annual Meeting.
How do I vote my proxy?
You can vote your proxy in one of the following ways:
| 1. | Via the internet,by visiting www.proxyvote.com. |
| 2. | By telephone,by calling the number on your proxy card, voting instruction form, or notice. | |
| 3. | By mail,by marking, signing, dating and mailing your proxy card if you requested printed materials, or your voting instruction form. No postage is required if mailed in the United States. | |
| 4. | In person,by attending the meeting in Cincinnati. | |
What do I need to attend the meeting in person in Cincinnati?
If you plan to attend the meeting, you must bring either: (1) the notice of meeting that was separately mailed to you or (2) the top portion of your proxy card, either of which will be your admission ticket.
You must also bring valid photo identification, such as a driver’s license or passport. We reserve the right to exclude any person who cannot provide an admission ticket and valid photo identification.
Can I change or revoke my proxy?
The common shares represented by each proxy will be voted in the manner you specified unless your proxy is revoked before it is exercised. You may change or revoke your proxy by providing written
1
notice to Kroger’s Secretary at 1014 Vine Street, Cincinnati, Ohio 45202-1100,45202, in person at the meeting or by executing and sending us a subsequent proxy.
How many shares are outstanding?
As of the close of business on April 27, 2016,May 2, 2018, the record date, our outstanding voting securities consisted of 953,786,557 common shares.
1
How many votes per share?
Each common share outstanding on the record date will be entitled to one vote on each of the 11 director nominees and one vote on each other proposal. Shareholders may not cumulate votes in the election of directors.
What voting instructions can I provide?
You may instruct the proxies to vote “For” or “Against” each proposal. Orproposal, or you may instruct the proxies to “Abstain” from voting.
What happens if proxy cards or voting instruction forms are returned without instructions?
If you are a registered shareholder and you return your proxy card without instructions, the Proxy Committee will vote in accordance with the recommendations of the Board of Directors.Board.
If you hold shares in street name and do not provide your broker with specific voting instructions on proposals 1, 2, 3, 4, 5, 6, 7, or 7,8, which are considerednon-routine matters, your broker does not have the authority to vote on those proposals. This is generally referred to as a “brokernon-vote.” Proposal 3,5, ratification of auditors, is considered a routine matter and, therefore, your broker may vote your shares according to your broker’s discretion.
The vote required, including the effect of brokernon-votes and abstentions for each of the matters presented for shareholder vote, is set forth below.
What are the voting requirements for each of the proposals?
Proposal No. 1 Election of Directors – An affirmative vote of the majority of the total number of votes cast “For” or “Against” a director nominee is required for the election of a director in an uncontested election. A majority of votes cast means that the number of shares voted “For” a director nominee must exceed the number of votes “Against” such director. Brokernon-votes and abstentions will have no effect on this proposal.
Proposal No. 2 Advisory Vote to Approve Executive Compensation – Advisory approval by shareholders of executive compensation requires the affirmative vote of the majority of shares participating in the voting. Brokernon-votes and abstentions will have no effect on this proposal.
Proposal No. 3 Vote to Approve Amendment to Regulations to Permit Proxy Access – An affirmative vote of the majority of the outstanding shares is required to amend the Regulations to permit proxy access. Brokernon-votes and abstentions will have the same effect as a vote against this proposal.
Proposal No. 4 Vote to Approve Amendment to Regulations to Permit Board Amendments in Accordance with Ohio Law – An affirmative vote of 75% of the outstanding shares is required to amend the Regulations to permit Board amendments of certain provisions. Brokernon-votes and abstentions will have the same effect as a vote against this proposal.
Proposal No. 5 Ratification of Independent Auditors – Ratification by shareholders of the selection of independent public accountants requires the affirmative vote of the majority of shares participating in the voting. Abstentions will have no effect on this proposal.
2
Proposal Nos. 4, 5, 6, 7, and 7,8 Shareholder Proposals– The affirmative vote of the majority of shares participating in the voting on a shareholder proposal is required for such proposal to pass. Accordingly, brokernon-votes and abstentions will have no effect on these proposals. Proxies will be voted against these proposals unless the Proxy Committee is otherwise instructed on a proxy properly executed and returned.
How does the Board of Directors recommend that I vote?
Proposal | For More | Board | ||||||||
Item No. 1 Election of Directors | See page 5 | FOR | ||||||||
Item No. 2 Advisory Vote to Approve Executive Compensation | See page 56 | FOR | ||||||||
Item No. 3 Amendment to Regulations to Permit Proxy Access | See page | FOR | ||||||||
Item No. | See page 59 | FOR | ||||||||
Item No. 5 Ratification of Independent Auditors | See page 60 | FOR | ||||||||
Item Nos. 6, 7, and 8 Shareholder Proposals | ||||||||||
| AGAINST | ||||||||||
Important Notice Regarding the Availability of Proxy Materials for the Shareholder
Meeting to be Held on June 23, 2016
The Notice of 20162018 Annual Meeting, Proxy Statement and 20152017 Annual Report and the means to vote by internet are available at www.proxyvote.com.
2
3
Kroger’s Corporate Governance Practices
Kroger is committed to strong corporate governance. We believe that strong governance builds trust and promotes the long-term interests of our shareholders. Highlights of our corporate governance practices include the following:
Board Governance Practices
| ✓ | Strong Board oversight of enterprise risk. |
| ✓ | All director nominees are independent, except for the CEO. |
| ✓ | All five Board |
| ✓ | ethics. |
| ✓ | |||
| Annual evaluation of the Chairman and CEO by the independent directors, led by the independent Lead Director. |
| ✓ | Annual Board and committee self-assessments. |
| ✓ | Commitment to Board refreshment and diversity. |
| ✓ | Regular executive sessions of the independent directors, at the Board and committee level. |
| ✓ | Strong independent Lead Director with clearly defined role and responsibilities. |
| ✓ | High degree of Board interaction with management to ensure successful oversight and succession planning. |
Shareholder Rights
| ✓ | All directors are elected annually with a simple majority standard for all uncontested director elections and by plurality in contested director elections. |
| ✓ | No poison pill (shareholder rights plan). |
| ✓ | Shareholders have the right to call a special meeting. |
| ✓ | Regular engagement with shareholders to understand their perspectives and concerns on a broad array of topics, including corporate governance matters. |
| ✓ | Responsive to shareholder feedback. |
Compensation Governance
| ✓ | Pay program tied to performance and business strategy. |
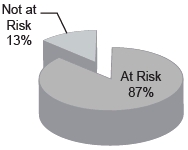
| ✓ | Majority of pay is long-term andat-risk with no guaranteed bonuses or salary increases. |
| ✓ | Stock ownership guidelines align executive and director interests with those of shareholders. |
| ✓ | Prohibition on all hedging, pledging and short sales of Kroger securities by directors and executive officers. |
| ✓ | No | ||
3
4
Proposals to Shareholders
Item No. 1. Election of Directors
You are being asked to elect 11 director nominees for aone-year term. The Board of Directors recommends that you vote FOR the election of all director nominees.
As of the date of this proxy statement, the KrogerKroger’s Board of Directors consists of twelve11 members. David B. Lewis will be retiring from the Board of Directors immediately prior to the 2016 annual meeting, in accordance with Kroger’s director retirement policy, and will not be standing for re-election. The number of directors will be reduced to eleven by the Board. All nominees, if elected at the 2016 annual meeting,2018 Annual Meeting, will serve until the annual meeting in 2017,2019, or until their successors have been elected by the shareholders or by the Board pursuant to Kroger’s Regulations, and qualified.
Kroger’s Articles of Incorporation provide that the vote required for election of a director nominee by the shareholders, except in a contested election or when cumulative voting is in effect, is the affirmative vote of a majority of the votes cast for or against the election of a nominee.
The experience, qualifications, attributes, and skills that led the Corporate Governance Committee and the Board to conclude that the following individuals should serve as directors are set forth opposite each individual’s name. The committee memberships stated below are those in effect as of the date of this proxy statement. Except as noted, each nominee has been employed by his or her present employer (or a subsidiary thereof) in an executive capacity for at least five years.
Nominees for Directors for Terms of Office Continuing until 20172019
Nora A. Aufreiter Age Director Since 2014 Committees: | Ms. Aufreiter is a Director Emeritus of McKinsey & Company, a global management consulting firm. She retired in June 2014 after more than 27 years with McKinsey, most recently as a director and senior partner. During that time, she worked extensively in the U.S., Canada, and internationally with major retailers, financial institutions and other consumer-facing companies. Before joining McKinsey, Ms. Aufreiter spent three years in financial services working in corporate finance and investment banking. She is a member of the Board of Directors of The Bank of Nova Scotia, The Neiman Marcus Group, and Cadillac Fairview, one of North America’s largest owners, operators and developers of commercial real estate. Ms. Aufreiter also serves on the boards of St. Michael’s Hospital and the Canadian Opera Company, and is a member of the Dean’s Advisory Board for the Ivey Business School in Ontario, Canada. Ms. Aufreiter has over 30 years of broad business experience in a variety of retail sectors. Her vast experience in leading McKinsey’s North American Retail Practice, North American Branding service line and the Consumer Digital and Omnichannel service line is of particular value to the Board. She also brings to the Board valuable insight on commercial real estate. | |
4
5
Robert D. Beyer Age Director Since 1999 Committees: | Mr. Beyer is Chairman of Chaparal Investments LLC, a private investment firm and holding company that he founded in 2009. From 2005 to 2009, Mr. Beyer served as Chief Executive Officer of The TCW Group, Inc., a global investment management firm. From 2000 to 2005, he served as President and Chief Investment Officer of Trust Company of the West, the principal operating subsidiary of TCW. Mr. Beyer is a member of the Board of Directors of Mr. Beyer brings to Kroger his experience as CEO of TCW, a global investment management firm serving many of the largest institutional investors in the U.S. He has exceptional insight into Kroger’s financial strategy, and his experience qualifies him to serve as a member of the Board. While at TCW, he also conceived and developed the firm’s risk management infrastructure, an experience that is useful to Kroger’s Board in performing its risk management oversight functions. His abilities and service as a director were recognized by his peers, who selected Mr. Beyer as an Outstanding Director in 2008 as part of the Outstanding Directors Program of the Financial Times. His strong insights into corporate governance form the foundation of his leadership role as Lead Director on the Board. | |
Anne Gates Age Director Since 2015 Committees: | Ms. Gates Ms. Gates has over | |
| * | Denotes Committee Chair |
6
Susan J. Kropf Age Director Since 2007 Committees: | Ms. Kropf was President and Chief Operating Officer of Avon Products Inc., a manufacturer and marketer of beauty care products, from 2001 until her retirement in January 2007. She joined Avon in 1970 and, during her tenure at Avon, Ms. Kropf also served as Executive Vice President and Chief Operating Officer, Avon North America and Global Business Operations from 1998 to 2000 and President, Avon U.S. from 1997 to 1998. Ms. Kropf was a member of Avon’s Board of Directors from 1998 to 2006. She currently is a director of Avon Products, Inc., Tapestry, Inc. (formerly known as Coach, Inc.), and Sherwin Williams Company. In the past five years she also served as a director of MeadWestvaco Corporation. Ms. Kropf has unique and valuable consumer insight, having led a major, publicly-traded retailer of beauty and related consumer products. She has extensive experience in manufacturing, marketing, supply chain operations, customer service, and product development, all of which assist her in her role as a member of Kroger’s Board. Ms. Kropf has a strong financial background, and has significant boardroom experience through her service on the boards of various public companies, including experience serving on compensation, audit, and corporate governance committees. She was inducted into the YWCA Academy of Women Achievers. Ms. Kropf received recognition from the National Association of Corporate Directors as an NACD Directorship 100 “Class of 2016” member. | |
5
W. Rodney McMullen Age Director Since 2003 | Mr. McMullen was elected Chairman of the Board in January 2015 and Chief Executive Officer of Kroger in January 2014. Mr. McMullen served as Kroger’s President and Chief Operating Officer from August 2009 to December 2013. Prior to that role, Mr. McMullen was elected to various roles at Kroger including Vice Chairman in 2003, Executive Vice President in 1999 and Senior Vice President in 1997. Mr. McMullen is a director of Cincinnati Financial Corporation and VF Corporation. Mr. McMullen has broad experience in the supermarket business, having spent his career spanning over | |
Jorge P. Montoya Age Director Since 2007 Committees: | Mr. Montoya was President of The Procter & Gamble Company’s Global Snacks & Beverage division, and President of Procter & Gamble Latin America, from 1999 until his retirement in 2004. Prior to that, he was an Executive Vice President of Procter & Gamble, a provider of branded consumer packaged goods, from 1995 to 1999. Mr. Montoya is a director of The Gap, Inc. Mr. Montoya brings to Kroger’s Board over 30 years of leadership experience at a premier consumer products company. He has a deep knowledge of the Hispanic market, as well as consumer products and retail operations. Mr. Montoya has vast experience in marketing and general management, including international business. He was named among the 50 most important Hispanics in Business & Technology, inHispanic Engineer & Information Technology Magazine. | |
| * | Denotes Committee Chair |
7
Clyde R. Moore Age Director Since 1997 Committees: | Mr. Moore was the Chairman of First Service Networks, a national provider of facility and maintenance repair services, until his retirement in 2015. Prior to Mr. Moore has over 30 years of general management experience in public and private companies. He has sound experience as a corporate leader overseeing all aspects of a facilities management firm and numerous manufacturing companies. Mr. Moore’s expertise broadens the scope of the Board’s experience to provide oversight to Kroger’s facilities, digital and manufacturing businesses. Additionally, his expertise and leadership as Chair of the Compensation and Talent Development Committee is of particular value to the Board. | |
Age 71
|
| |
6
Director Since 2006 Committees: | Mr. Runde is a special advisor and a former Vice Chairman of Morgan Stanley, a financial services provider, where he was employed from 1974 until his retirement in 2015. He was a member of the Board of Directors of Burlington Resources, Inc. prior to its acquisition by ConocoPhillips in 2006. Mr. Runde serves as a Trustee Emeritus of Marquette University and the Pierpont Morgan Library. Mr. Runde brings to Kroger’s Board a strong financial background, having led a major financial services provider. He also has served on the compensation committee of a major corporation. | |
Ronald L. Sargent Age Director Since 2006 Committees: | Mr. Sargent is the former Chairman and Chief Executive Officer of Staples, Inc., a business products retailer, where he Mr. Sargent has over 35 years of retail experience, first with Kroger and then with increasing levels of responsibility and leadership at Staples, Inc. His efforts helped carve out a new market niche for the international | |
Bobby S. Shackouls Age Director Since 1999 Committees: | Mr. Shackouls was Chairman of the Board of Burlington Resources Inc., a natural resources business, from July 1997 until its merger with ConocoPhillips in 2006 and its President and Chief Executive Officer from December 1995 until 2006. Mr. Shackouls was also the President and Chief Executive Officer of Burlington Resources Oil and Gas Company (formerly known as Meridian Oil Inc.), a wholly-owned subsidiary of Burlington Resources, from 1994 to 1995. Mr. Shackouls is a director of Plains GP Holdings, Mr. Shackouls brings to the Board the critical thinking that comes with a chemical engineering background, as well as his experience leading a major natural resources company, coupled with his corporate governance expertise. | |
| * | Denotes Committee Chair |
8
Mark S. Sutton Age 56 Director Since 2017 Committees: Audit Public Responsibilities | Mr. Sutton is Chairman and Chief Executive Officer of International Paper, a leading global producer of renewable fiber-based packaging, pulp and paper products. Prior to becoming CEO, he served as President and Chief Operating Officer with responsibility for running the company’s global business. Mr. Sutton joined International Paper in 1984 as an electrical engineer. He held roles of increasing responsibility throughout his career, including mill manager, Vice President of corrugated packaging operations across Europe, the Middle East and Africa, Vice President of corporate strategic planning, and Senior Vice President of several business units, including global supply chain, before being named CEO in 2014. He serves on the boards of the American Forest & Paper Association, the Business Roundtable, the International Advisory Board of the Moscow School of Management — Skolkovo, Memphis Tomorrow and the New Memphis Institute. Mr. Sutton has over thirty years of leadership experience with increasing levels of responsibility and leadership at International Paper. He brings to the Board the critical thinking that comes with an electrical engineering background as well as his experience leading a global company. His strong strategic planning background and supply chain experience are of particular value to the Board. Mr. Sutton has been designated an Audit Committee financial expert. | |
The Board of Directors Recommends a VoteFor Each Director Nominee.
Diversity of Background
Our director nominees possess relevant experience, skills and qualifications that contribute to a well-functioning Board that effectively oversees the Company’s strategy and management. Listed below are the skills and experience that we consider important for our directors in light of our current business, strategy and structure:
Nora | Robert Beyer | Anne Gates | Susan Kropf | Rodney McMullen | Jorge Montoya | Clyde Moore | James Runde | Ronald Sargent | Bobby Shackouls | Mark Sutton | Total (of 11) | |||||||||||||||||||||||||||||||||||||||||||||||||
Business Management | 🌑 | 🌑 | 🌑 | 🌑 | 🌑 | 🌑 | 🌑 | 🌑 | 🌑 | 🌑 | 🌑 | 11 | ||||||||||||||||||||||||||||||||||||||||||||||||
Retail | 🌑 | 🌑 | 🌑 | 🌑 | 🌑 | 🌑 | 6 | |||||||||||||||||||||||||||||||||||||||||||||||||||||
Consumer | 🌑 | 🌑 | 🌑 | 🌑 | 🌑 | 🌑 | 6 | |||||||||||||||||||||||||||||||||||||||||||||||||||||
Financial Expertise | 🌑 | 🌑 | 🌑 | 🌑 | 🌑 | 🌑 | 🌑 | 🌑 | 🌑 | 9 | ||||||||||||||||||||||||||||||||||||||||||||||||||
Risk Management | 🌑 | 🌑 | 🌑 | 🌑 | 🌑 | 🌑 | 6 | |||||||||||||||||||||||||||||||||||||||||||||||||||||
Operations &Technology | 🌑 | 🌑 | 🌑 | 🌑 | 🌑 | 🌑 | 🌑 | 🌑 | 🌑 | 9 | ||||||||||||||||||||||||||||||||||||||||||||||||||
Sustainability | 🌑 | 🌑 | 🌑 | 🌑 | 🌑 | 🌑 | 6 | |||||||||||||||||||||||||||||||||||||||||||||||||||||
Manufacturing | 🌑 | 🌑 | 🌑 | 🌑 | 4 | |||||||||||||||||||||||||||||||||||||||||||||||||||||||
9
|  |
Information Concerning the Board of Directors
Board Leadership Structure and Lead Independent Director
The Board is currently composed of eleventen independentnon-employee directors and one management director, Mr. McMullen, the Chairman and CEO. Kroger has a balanced governance structure in which independent directors exercise meaningful and vigorous oversight.
In addition, asAs provided in theKroger’sGuidelines on Issues of Corporate Governance(the “Guidelines”), the Board has designated one of the independent directors as Lead Director. The Lead Director works with the Chairman to share governance responsibilities, facilitate the development of Kroger’s strategy and grow shareholder value. The Lead Director serves a variety of roles, consistent with current best practices, including:
The Lead Director carries out these responsibilities in numerous ways, including:
| |
Unless otherwise determined by the independent members of the Board, the chairChair of the Corporate Governance Committee is designated as the Lead Director. Robert D. Beyer, an
10
independent director and the chairChair of the Corporate Governance Committee, is currently the Lead Director. Mr. Beyer is an effective Lead Director for Kroger due to, among other things, things:
With respect to the roles of Chairman and CEO, theGuidelines provide that the Board will determine whenwhether it is in the best interests of Kroger and our shareholders for the roles to be separated or combined, and thecombined. The Board exercises its discretionthis judgment as it deems appropriate in light of prevailing circumstances. Upon retirement of our former Chairman, David B. Dillon, on December 31, 2014, the Board determined that it is in the best interests of Kroger and our shareholders for one person to serve as the Chairman and CEO, as was the case from 2004 through 2013.2013, with another individual serving as independent Lead Director. The Board believes that this leadership structure improves the Board’s ability to focus on key policy and operational issues and helps the Company operate in the long-term interestsinterest of shareholders. Additionally, this structure provides an effective balance between strong Company leadership and appropriate safeguards and oversight by independent directors. The Board believes that the combination or separationstructure of these positionsthe Chairman and independent Lead Director position should continue to be considered as part of the succession planning process, as was the case in 2003 and 2014 when the roles were separated.process.
8Annual Board Evaluation Process
The Board and each of its committees conduct an annual self-evaluation to determine whether the Board is functioning effectively both at each level.the Board and at the committee levels. As part of this annual self-evaluation, the Board assesses whether the current leadership structure and function continues to be appropriate for Kroger and its shareholders. TheGuidelines provide the flexibility for the Board to modify our leadership structure in the future as appropriate. We believe that Kroger, like many U.S. companies, has beenis well-served by this flexible leadership structure.
The Board recognizes that a robust evaluation process is an essential component of strong corporate governance practices and promoting Board effectiveness. The Corporate Governance Committee oversees an annual evaluation process led by the Lead Independent Director (who also serves as Chair of the Corporate Governance Committee).
Each director completes an annual self-evaluation of the Board and the committees on which he or she serves. These self-evaluations are designed to help assess the skills, qualifications, and experience represented on the Board and its committees, and to determine whether the Board and its committees are functioning effectively. The results of this annual self-evaluation are discussed by the full Board and each committee, as applicable, and changes to the Board’s and its committees’ practices are implemented as appropriate.
Committees of the Board of Directors
To assist the Board in undertaking its responsibilities, and to allow deeper engagement in certain areas of company oversight, the Board has established five standing committees: Audit, Compensation and Talent Development (“Compensation”), Corporate Governance, Financial Policy and Public Responsibilities. All committees are composed exclusively of independent directors, as determined under the NYSE listing standards. The current charter of each Board committee is available on our website at ir.kroger.com under Corporate Governance –Investors —Governance — Committee Composition.
11
| Name of Committee, Number of Meetings, and Current Members | Committee Functions | |
Audit Committee Meetings in Members: | • Oversees the Company’s financial reporting and accounting matters, including review of the Company’s financial statements and the audit thereof, the Company’s financial reporting and accounting process, and the Company’s systems of internal control over financial reporting • Selects, evaluates and oversees the compensation and work of the independent registered public accounting firm and reviews its performance, qualifications, and independence • Oversees and evaluates the Company’s internal audit function, including review of its audit plan, policies and procedures and significant findings • Oversees risk assessment and risk management, including review of cybersecurity risks as well as legal or regulatory matters that could have a significant effect on the Company • Reviews and monitors the Company’s compliance programs, including the whistleblower program | |
Compensation Committee Meetings in Members: | • Recommends for approval by the independent directors the compensation of the CEO, and • Administers the Company’s executive compensation policies and programs, including determining grants of equity awards under the plans • Has sole authority to retain and direct the committee’s compensation consultant • Assists the full Board with senior management succession planning | |
Corporate Governance Committee Meetings in 2017: 2 Members: | • Oversees the Company’s corporate governance policies and procedures • Develops criteria for selecting and retaining directors, including identifying and recommending qualified candidates to be director nominees • Designates membership and Chairs of Board committees • Reviews the Board’s performance and director independence • Establishes and reviews the practices and procedures by which the Board performs its functions | |
9
12
| Name of Committee, Number of Meetings, and Current Members | Committee Functions | |
| ||
Financial Policy Committee Meetings in Members: | • Reviews and recommends financial policies and practices • Oversees management of the Company’s financial resources • Reviews the Company’s annual financial plan, significant capital investments, plans for major acquisitions or sales, issuance of new common or preferred stock, dividend policy, creation of additional debt and other capital structure considerations including additional leverage or dilution in ownership • Monitors the investment management of assets held in pension and profit sharing plans administered by the Company | |
Public Responsibilities Committee Meetings in Members: | • Reviews the Company’s policies and practices affecting its social and public responsibility as a corporate citizen, including: community relations, charitable giving, supplier diversity, sustainability, government relations, political action, consumer and media relations, food and pharmacy safety and the safety of customers and employees • Reviews and examines the Company’s evaluation of and response to changing public expectations and public issues affecting the business | |
Director Nominee Selection Process
The Corporate Governance Committee is responsible for recommending to the Board a slate of nominees for election at each annual meeting of shareholders. The Corporate Governance Committee recruits candidates for Board membership through its own efforts and through recommendations from other directors and shareholders. In addition, the Corporate Governance Committee has retained an independent search firm to assist in identifying and recruiting director candidates who meet the criteria established by the Corporate Governance Committee.
These criteria are:
10
The Corporate Governance Committee also considers the specific experience and abilities of director candidates in light of our current business, strategy and structure and the current or expected needs of the Board in its identification and recruitment of director candidates.
13
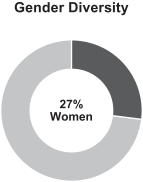
Board Diversity and Succession Planning
Our director nominees reflect a wide array of experience, skills and backgrounds. Each director is individually qualified to make unique and substantial contributions to Kroger. Collectively, our directors’ diverse viewpoints and independent-mindedness enhance the quality and effectiveness of Board deliberations and decision making. Our Board is a dynamic group of new and experienced members, providing an appropriate balance of institutional knowledge and fresh perspectives about Kroger due to the varied length of tenure on the Board. This blend of qualifications, attributes and tenure results in highly effective board leadership.
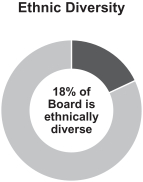
The Corporate Governance Committee considers racial, ethnic and gender diversity to be important elements in promoting full, open and balanced deliberations of issues presented to the Board. The Corporate Governance Committee considers director candidates that help the Board reflect the diversity of our shareholders, associates, customers and the communities in which we operate. Some consideration also is given to the geographic location of director candidates in order to provide a reasonable distribution of members from Kroger’s operating areas.
At least annually, theBoard succession planning is an ongoing, year-round process. The Corporate Governance Committee activelyrecognizes the importance of thoughtful Board refreshment, and engages in a continuing process of identifying attributes sought for future Board succession planning.members. The Corporate Governance Committee takes into account the Board and committee evaluations regarding the specific backgrounds,qualities, skills, and experiences that would contribute to overall Board and committee effectiveness, as well as the future needs of the Board and its committees in light of Kroger’s current and futurelong-term business strategies, and the skills and qualifications of directors who are expected to retire in the future.
Shareholder Engagement
Maintaining ongoing relationships with our shareholders, and understanding our shareholders’ views, is a priority for both our Board and management team. We have a longstanding history of engaging with our shareholders through our investor relations team’s year-round outreach program. At the direction of our Board, we expanded our shareholder engagement program in 2016 to include outreach to our largest shareholders’ governance teams. In 2017, we requested meetings with shareholders representing nearly 40% of our outstanding shares and ultimately engaged with shareholders representing over a third of our outstanding shares.
During these engagements, we discussed and solicited feedback on a range of topics, including business strategy, corporate governance, executive compensation and sustainability. In addition, we attended industry events to further engage with shareholders and subject matter experts. These conversations provided valuable insights into our shareholders’ perspectives and their feedback was shared with, and considered by, our full Board.
Candidates Nominated by Shareholders
The Corporate Governance Committee will consider shareholder recommendations for director nominees for membership onelection to the Board of Directors.Board. If shareholders wish to nominate a person or persons for election to the Board at our 20172019 annual meeting, written notice must be submitted to Kroger’s Secretary, and received at our executive offices, in accordance with Kroger’s Regulations, not later than March 28, 2017.31, 2019. Such notice should include the name, age, business address and residence address of such person, the principal occupation or employment of such person, the number of Kroger common shares owned of record or beneficially by such person and any other information relating to the person that would be required to be included in a proxy statement relating to the election of directors. The Secretary will forward the information to the Corporate Governance Committee for its consideration. The Corporate Governance Committee will use the same criteria in evaluating candidates submitted by shareholders as it uses in evaluating candidates identified by the Corporate Governance Committee, as described above. See “Director Nominee Selection Process.”
14
If Item No. 3 on proxy access is approved by the requisite vote at the 2018 Annual Meeting, eligible shareholders will have the ability to submit director nominees for inclusion in our proxy statement for the 2019 annual meeting of shareholders. As described in more detail in Item No. 3, to be eligible, shareholders must have owned at least 3% of our common shares for at least three years. Up to 20 shareholders will be able to aggregate for this purpose. Nominations must be submitted to our Corporate Secretary at our principal executive offices no earlier than December , 2018 and no later than January __, 2019.
Corporate Governance Guidelines
The Board has adopted theGuidelines on Issues of Corporate Governance. TheGuidelines, which includeincludes copies of the current charters for each of the five standing committees of the Board,Board. TheGuidelines are available on our website at ir.kroger.com under CorporateInvestors – Governance – Highlights.Guidelines on Issues of Corporate Governance. Shareholders may also obtain a copy of theGuidelines by making a written request to Kroger’s Secretary at our executive offices.
Independence
The Board has determined that all of thenon-employee directors have no material relationships with Kroger and therefore,satisfy the criteria for independence set forth in Rule 303A.02 of the New York Stock Exchange Listed Company Manual. Therefore, allnon-employee directors are independent for purposes of the New York Stock ExchangeNYSE listing standards. The Board made its determination based on information furnished by all members regarding their relationships with Kroger and its management, and other relevant information. After reviewing The Board considered, among other things, that
In determining that Mr. Sargent is independent, the Board considered transactions during fiscal 2015 between Kroger and Staples, Inc. (where Mr. Sargent is Chairman and CEO) and determined that the amount of business fell below the thresholds set by the NYSE listing standards. The transactions involved the purchase of goods bystandards, and
11
Audit Committee Expertise
The Board has determined that Anne Gates, Susan M. Phillips and Ronald L. Sargent and Mark S. Sutton, independent directors who are members of the Audit Committee, are “audit committee financial experts” as defined by applicable SEC regulations and that all members of the Audit Committee are “financially literate” as that term is used in the NYSE listing standards and are independent in accordance with Rule10A-3 of the Securities Exchange Act of 1934.
Code of Ethics
The Board has adoptedThe Kroger Co. Policy on Business Ethics, applicable to all officers, employees and directors, including Kroger’s principal executive, financial and accounting officers. ThePolicy is available on our website at ir.kroger.com under CorporateInvestors – Governance – Highlights.Policy on Business Ethics. Shareholders may also obtain a copy of thePolicy by making a written request to Kroger’s Secretary at our executive offices.
Communications with the Board
The Board has established two separate mechanisms for shareholders and interested parties to communicate with the Board. Any shareholder or interested party who has concerns regarding accounting, improper use of Kroger assets or ethical improprieties may report these concerns via the toll-free hotline(800-689-4609) or email address (helpline@kroger.com) established by the Board’s Audit Committee. The concerns are investigated by Kroger’s Vice President, Chief Ethics and Compliance Officer and the Vice President of AuditingInternal Audit and reported to the Audit Committee as deemed appropriate by the Vice President of Auditing.appropriate.
Shareholders or interested parties also may communicate with the Board in writing directed to Kroger’s Secretary at our executive offices. Communications relating to personnel issues or our
15
ordinary business operations, or seeking to do business with us, will be forwarded to the business unit of Kroger that the Secretary deems appropriate. All other communications will be forwarded to the chairChair of the Corporate Governance Committee for further consideration. The chairChair of the Corporate Governance Committee will take such action as he or she deems appropriate, which may include referral to the full Corporate Governance Committee or the entire Board.
Attendance
The Board held fivesix meetings in fiscal year 2015.2017. During fiscal year 2015,2017, all incumbent directors attended at least 75% of the aggregate number of meetings of the Board and committees on which that director served. Members of the Board are expected to use their best efforts to attend all annual meetings of shareholders. All eleven11 members then serving on the Board attended last year’s annual meeting.
Independent Compensation Consultants
The Compensation Committee directly engages a compensation consultant from Mercer Human Resource Consulting to advise the Compensation Committee in the design of Kroger’s executive compensation. The Committee retained a consultant from Mercer Human Resource Consulting (“Mercer”) from 2001 through December 2017. Retained by and reporting directly to the Compensation Committee, Mercer provided the Committee with assistance in evaluating Kroger’s executive compensation programs and policies.
In 2015,fiscal 2017, Kroger paid that consultant $390,767Mercer $361,147 for work performed for the Compensation Committee. Kroger, on management’s recommendation, retained the parent and affiliated companies of Mercer Human Resource Consulting to provide other services for Kroger in 2015,fiscal 2017, for which Kroger paid $2,339,577.$8,394,369. These other services primarily related to insurance claims (for which Kroger was reimbursed by insurance carriers as claims were adjusted), insurance brokerage and bonding commissions provided by Marsh USA Inc., and pension plan compliance and actuary services provided by Mercer Inc. Kroger also made payments to affiliated companies for insurance premiums that were collected by the affiliated companies of Mercer on behalf of insurance carriers, but these amounts are not included in the totals referenced above, as the amounts were paid over to insurance carriers for services provided by those carriers.
12
Although neither Neither the Compensation Committee nor the Board expressly approved the other services afterprovided by Mercer. After taking into consideration the NYSE’s independence standards and the SEC rules, the Compensation Committee determined that the Mercer consultant iswas independent and hisMercer’s work has not raised any conflict of interest because:
In July 2017, the Committee invited proposals from other executive compensation consulting firms. Following consideration of several firms, in December 2017, the Committee engaged Korn Ferry Hay Group (“Korn Ferry”) as its executive compensation consultant. Due to the timing of the engagement, Korn Ferry did not have an opportunity to assist the Committee with the design and development of the executive compensation programs for fiscal 2017, other than assisting in the final determination of fiscal 2017 payouts.
After taking into consideration the NYSE’s independence standards and the SEC rules, the Compensation Committee determined that the Korn Ferry consultant was independent and Korn Ferry’s work has not raised any conflict of interest.
16
The Compensation Committee may engage an additional compensation consultant from time to time as it deems advisable.
Compensation Committee Interlocks and Insider Participation
No member of the Compensation Committee was an officer or employee of Kroger during fiscal 2015,2017, and no member of the Compensation Committee is a former officer of Kroger or was a party to any disclosable related person transaction involving Kroger.Kroger required to be disclosed under Item 404 of RegulationS-K. During fiscal 2015,2017, none of our executive officers served on the board of directors or on the compensation committee of any other entity that has or had executive officers serving as a member of Kroger’s Board of Directors or Compensation Committee of the Board.
Board Oversight of Enterprise Risk
While risk management is primarily the responsibility of Kroger’s management team, the Board is responsible for strategic planning and overall supervision of our risk management activities. The Board’s oversight of the material risks faced by Kroger occurs at both the full Board level and at the committee level.
The Board receives presentations throughout the year from various department and business unit leaders that include discussion of significant risks as necessary. At each Board meeting, the Chairman and CEO addresses matters of particular importance or concern, including any significant areas of risk that require Board attention. Additionally, through dedicated sessions focusing entirely on corporate strategy, the full Board reviews in detail Kroger’s short- and long-term strategies, including consideration of significant risks facing Kroger and their potential impact. The independent directors, in executive sessions led by the Lead Director, address matters of particular concern, including significant areas of risk, that warrant further discussion or consideration outside the presence of Kroger employees. At the committee level, reports are given by management subject matter experts to each committee on risks within the scope of their charters.
The Audit Committee has oversight responsibility not only for financial reporting of Kroger’s major financial exposures and the steps management has taken to monitor and control those exposures, but also for the effectiveness of management’s processes that monitor and manage key business risks facing Kroger, as well as the major areas of risk exposure, and management’s efforts to monitor and control that exposure.the major areas of risk exposure including cybersecurity risk. The Audit Committee incorporates its risk oversight function into its regular reports to the Board and also discusses with management its policies with respect to risk assessment and risk management.
Management including our Chief Ethics and Compliance Officer, provides regular updates throughout the year to the respective Board committees regarding management of the risks they oversee,oversee. For example, our Vice President, Chief Ethics and each of these committeesCompliance Officer provides regular updates to the Audit Committee on our compliance risks and actions taken to mitigate that risk; and our Executive Vice President and Chief Information Officer and our Chief Information Security Officer provide regular updates on our cybersecurity risks and actions taken to mitigate that risk to the Audit Committee. The Audit Committee reports on risk to the full Board at each regular meeting of the Board.
We believe that our approach to risk oversight, as described above, optimizes our ability to assess inter-relationships among the various risks, make informed cost-benefit decisions, and approach emerging risks in a proactive manner for Kroger. We also believe that our risk structure complements our current Board leadership structure, as it allows our independent directors, through the five fully independent Board committees, and in executive sessions of independent directors led by the Lead Director, to exercise effective oversight of the actions of management, led by Mr. McMullen as Chairman of the Board and CEO, in identifying risks and implementing effective risk management policies and controls.
13
Compensation Discussion and Analysis
Executive Summary17
Named Executive Officers
Director Compensation
This2017 Director Compensation Discussion and Analysis provides a discussion and analysis of our compensation program for our named executive officers (“NEOs”). For the 2015 fiscal year ended January 30, 2016, the NEOs were:
Messrs. Schlotman, Donnelly, Hjelm and Morganthall were each promoted to the position of Executive Vice President effective September 1, 2015.
Executive Compensation in Context: Our Growth Plan, Financial Strategy and Fiscal Year 2015 Results
Kroger’s growth plan includes four key performance indicators: positive identical supermarket sales without fuel (“ID Sales”) growth, slightly expanding non-fuel first in, first out (“FIFO”) operating margin, growing return on invested capital (“ROIC”), and annual market share growth. In 2015, we met or exceeded our goals for each of these performance indicators:
The compensation of our NEOs in 2015 reflects Kroger’s short-term and long-term goals and outcomes. Total compensation for the year is an indicator of how well Kroger performed compared to our business plan, reflecting how our compensation program responds to business challenges and the marketplace.
14
Summary of Key Compensation Practices
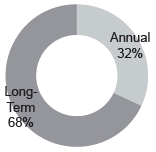
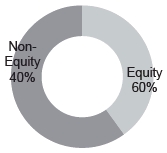
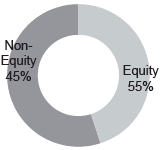
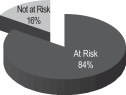
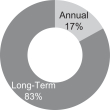
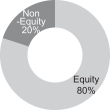
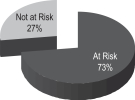
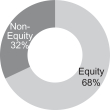
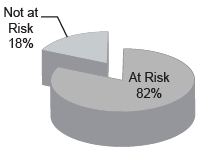
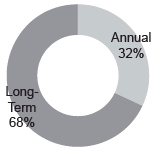
Summary of Fixed and At-Risk Pay Elements
The fixed and at-risk pay elements of NEO compensation are reflected in the following table and charts. The amounts used in the charts are based on the amounts reported in the Summary Compensation Table for 2015, excluding the Change in Pension Value and Nonqualified Deferred Compensation Earnings column.
| |||||
15
| |||||
|
| |
|
|
16
|
|
The following discussion and analysis addresses the compensation of the NEOs and the factors considered by the Compensation Committee in setting compensation for the NEOs and, in the case of the CEO’s compensation, making recommendations to the independent directors. Additional detail is provided in the compensation tables and the accompanying narrative disclosures that follow this discussion and analysis.
Our Compensation Philosophy and Objectives
As one of the largest retailers in the world, our executive compensation philosophy is to attract and retain the best management talent and to motivate these employees to achieve our business and financial goals. Kroger’s incentive plans are designed to reward the actions that lead to long-term value creation. The Compensation Committee believes that there is a strong link between our business strategy, the performance metrics in our short-term and long-term incentive programs, and the business results that drive shareholder value.
We believe our strategy creates value for shareholders in a manner consistent with our focus on our core values: honesty, integrity, respect, inclusion, diversity and safety.
To achieve our objectives, the Compensation Committee seeks to ensure that compensation is competitive and that there is a direct link between pay and performance. To do so, it is guided by the following principles:
| |
| |
| |
| |
| |
| |
|
17
Components of Executive Compensation at Kroger
Compensation for our NEOs is comprised of the following:
| |
The annual and long-term performance-based compensation awards described herein were made pursuant to our 2011 Long-Term Incentive and Cash Bonus Plan and our 2014 Long-Term Incentive and Cash Bonus Plan, each of which was approved by our shareholders in 2011 and 2014, respectively.
Annual Compensation – Salary
Our philosophy with respect to salary is to provide a sufficient and stable source of fixed cash compensation. All of our compensation cannot be at-risk or long-term. It is important to provide a meaningful annual salary to attract and retain a high caliber leadership team, and to have an appropriate level of cash compensation that is not variable.
Salaries for the NEOs (with the exception of the CEO) are established each year by the Compensation Committee, in consultation with the CEO. The CEO’s salary is established by the independent directors. Salaries for the NEOs are reviewed annually in June.
The amount of each NEO’s salary is influenced by numerous factors including:
The assessment of individual contribution is a qualitative determination, based on the following factors:
18
The amounts shown below reflect the salaries of the NEOs effective at the end of each fiscal year.
| Salary | ||||||||
| 2013 | 2014 | 2015 | ||||||
| W. Rodney McMullen(1) | $ | 1,100,000 | $ | 1,200,000 | $ | 1,240,000 | ||
| J. Michael Schlotman(2) | $ | 735,000 | $ | 760,000 | $ | 840,000 | ||
| Michael J. Donnelly(2) | $ | 643,560 | $ | 662,900 | $ | 750,000 | ||
| Christopher T. Hjelm(2)(3) | $ | 700,000 | ||||||
| Frederick J. Morganthall II(2)(3) | $ | 670,000 | ||||||
Annual Compensation – Performance-Based Annual Cash Bonus
The NEOs, along with approximately 13,000 of their fellow Kroger associates, participate in a performance-based annual cash bonus plan. Approximately 7,000 of those associates are eligible for the same plan as the NEOs. The remaining associates are eligible for an annual cash bonus plan of which 40% is based on the Kroger corporate plan and 60% is based on the metrics and targets for their respective supermarket division or operating unit of the Company.
Over time, the Compensation Committee and our independent directors have placed an increased emphasis on our strategic plan by making the targets more difficult to achieve. The annual cash bonus plan is structured to encourage high levels of performance. A threshold level of performance must be achieved before any payouts are earned, while a payout of up to 200% of target can be achieved for superior performance.
The amount of annual cash bonus that the NEOs earn each year is based upon Kroger’s performance compared to targets established by the Compensation Committee and the independent directors based on the business plan adopted by the Board of Directors.
The annual cash bonus plan is designed to encourage decisions and behavior that drive the annual operating results and the long-term success of the Company. Kroger’s success is based on a combination of factors, and accordingly the Compensation Committee believes that it is important to encourage behavior that supports multiple elements of our business strategy.
Establishing Annual Cash Bonus Potentials
The Compensation Committee establishes annual cash bonus potentials for each NEO, other than the CEO, whose annual cash bonus potential is established by the independent directors. Actual payouts, which can exceed 100% of the potential amounts but may not exceed 200% of the potential amounts, represent the extent to which performance meets or exceeds the goals established by the Compensation Committee. Actual payouts may be as low as zero if performance does not meet the goals established by the Compensation Committee.
The Compensation Committee considers multiple factors in making its determination or recommendation as to annual cash bonus potentials:
19
The annual cash bonus potential in effect at the end of the fiscal year for each NEO is shown below. Actual annual cash bonus payouts are prorated to reflect changes, if any, to bonus potentials during the year.
| Annual Cash Bonus Potential | ||||||||
| 2013 | 2014 | 2015 | ||||||
| W. Rodney McMullen(1) | $ | 1,500,000 | $ | 1,600,000 | $ | 1,650,000 | ||
| J. Michael Schlotman(2) | $ | 550,000 | $ | 550,000 | $ | 600,000 | ||
| Michael J. Donnelly(2) | $ | 425,000 | $ | 550,000 | $ | 600,000 | ||
| Christopher T. Hjelm(2)(3) | $ | 600,000 | ||||||
| Frederick J. Morganthall II(2)(3) | $ | 600,000 | ||||||
Annual Cash Bonus Plan Metrics and Connection to our Business Plan
The annual cash bonus plan has the following measurable performance metrics, all of which are interconnected, and individually necessary to sustain our business model and achieve our growth strategy:
|
| |
|
|
20
|
| |
|
| |
|
| |
|
|
The use of these four primary metrics creates checks and balances on the various behaviors and decisions that impact the long-term success of the Company. The ID Sales, EBITDA without fuel and Customer 1st Strategy metrics are weighted equally to highlight the need to simultaneously achieve all three metrics in order to maintain our growth.
We aligned the weighting of ID Sales and EBITDA without fuel metrics to emphasize sales growth balanced with the focus on profit. Kroger’s business is not sustainable if we merely increase our ID Sales, but do not have a corresponding increase in earnings. Furthermore, payouts in the ID Sales and EBITDA without fuel segments are interrelated. Achieving the goal for both the ID Sales and EBITDA without fuel results in a higher percentage payout on both elements. Achieving the target on one, but not the other will limit the payout percentage on both.
By supporting the Customer 1st Strategy and the Four Keys, we will better connect with our customers. Our unique competitive advantage is our ability to deliver on the Four Keys, which are the items that matter most to our customers, and it is that multi-faceted achievement that we believe drives our ID Sales growth.
As we strive to achieve our aggressive growth targets, we also continuously aim to reduce our operating costs as a percentage of sales, without fuel. Productivity improvements and other reductions in operating costs allow us to reduce costs in areas that do not matter to our customers so that we can
21
invest money in the areas that matter the most to our customers, like the Four Keys. We carefully manage operating cost reductions to ensure a consistent delivery of the customer experience. This again shows the need to have multiple metrics, to create checks and balances on the various behavior and decisions that are influenced by the design of the bonus plan.
Results of 2015 Annual Cash Bonus Plan
The 2015 goals established by the Compensation Committee, the actual 2015 results and the bonus percentage earned for each of the performance metrics of the annual cash bonus plan were as follows:
| Actual | ||||||||||||
| Performance | ||||||||||||
| Goals | Compared to | Amount | ||||||||||
| Target | Actual | Target | Weight | Earned | ||||||||
| Performance Metrics | Minimum | (100%) | Performance(1) | (A) | (B) | (A) x (B) | ||||||
| ID Sales | 2.1% | 4.1% | 5.0% | 134.3% | 30% | 40.3% | ||||||
| EBITDA without Fuel | $4.4384 | $5.2217 | $5.2351 | |||||||||
| Billion | Billion | Billion | 126.3%(2) | 30% | 37.9% | |||||||
| Customer 1stStrategy(3) | * | * | * | * | 30% | 39.0% | ||||||
| Over | Over | Over | 45.0% | 10% | 4.5% | |||||||
| Total Operating Costs as | budget by | budget by | budget by | |||||||||
| Percentage of Sales, | 25 basis | 5 basis | 16 basis | |||||||||
| without Fuel(4) | points | points | points | |||||||||
| 0% | 5.0% | |||||||||||
| Fuel Bonus(5) | [As described in the footnote below] | or 5% | ||||||||||
| Total Earned | 126.7% | |||||||||||
Following the close of the year, the Compensation Committee reviewed Kroger’s performance against each of the metrics outlined above and determined the extent to which Kroger achieved those objectives. The Compensation Committee believes our management produced outstanding results in 2015, measured against increasingly aggressive business plan objectives. Due to our performance when compared to the goals established by the Compensation Committee, and based on the business plan adopted by the Board, the NEOs and all other participants in the corporate annual cash bonus plan earned 126.7% of their bonus potentials.
In 2015, as in all years, the Compensation Committee retained discretion to reduce the annual cash bonus payout for all executive officers, including the NEOs, if the Compensation Committee determined for any reason that the bonus payouts were not appropriate given their assessment of Company performance. The independent directors retained that discretion for the CEO’s bonus. The Compensation Committee and the independent directors also retained discretion to adjust the goals for each metric
22
under the plan should unanticipated developments arise during the year. No adjustments were made to the goals in 2015. The Compensation Committee, and the independent directors in the case of the CEO, determined that the annual cash bonus payouts earned appropriately reflected the Company’s strong performance in 2015 and therefore should not be adjusted.
The actual annual cash bonus percentage payout for 2015 represented excellent performance that exceeded our business plan objectives, with the exception of operating costs as a percentage of sales, without fuel. The strong link between pay and performance is illustrated by a comparison of earned amounts under our annual cash bonus plan in previous years, such as 2009, 2010 and 2012, when payouts were less than 100%. In those years, we did not achieve all of our business plan objectives.A comparison of actual annual cash bonus percentage payouts in prior years demonstrates the variability of annual cash bonus incentive compensation and its strong link to our performance:
| Annual Cash Bonus | |||
| Fiscal Year | Payout Percentage | ||
| 2015 | 126.7 | % | |
| 2014 | 121.5 | % | |
| 2013 | 104.9 | % | |
| 2012 | 85.9 | % | |
| 2011 | 138.7 | % | |
| 2010 | 53.9 | % | |
| 2009 | 38.5 | % | |
| 2008 | 104.9 | % | |
| 2007 | 128.1 | % | |
| 2006 | 141.1 | % | |
As described above, the annual cash bonus payout percentage is applied to each NEO’s bonus potential, which is determined by the Compensation Committee, and the independent directors in the case of the CEO. The actual amounts of performance-based annual cash bonuses paid to the NEOs for 2015 are reported in the Summary Compensation Table in the “Non-Equity Incentive Plan Compensation” column and footnote 4 to that table.
Long-Term Compensation
The Compensation Committee believes in the importance of providing an incentive to the NEOs to achieve the long-term goals established by the Board. As such, a majority of compensation is conditioned on the achievement of the Company’s long-term goals and is delivered via four long-term compensation vehicles: long-term cash bonus, performance units, stock options and restricted stock. Long-term compensation promotes long-term value creation and discourages the over-emphasis of attaining short-term goals at the expense of long-term growth.
The Compensation Committee considers several factors in determining the target value of long-term compensation awarded to the NEOs or, in the case of the CEO, recommending to the independent directors the amount awarded. These factors include:
| |
23
Long-term incentives are structured to be a combination of performance- and time-based compensation that reflects elements of financial and stock performance to provide both retention value and alignment with company performance. Long-term cash bonus and performance unit payouts are contingent on the achievement of certain strategic performance and financial measures and incentivize recipients to promote long-term value creation and enhance shareholder wealth by supporting the Company’s long-term strategic goals. Stock options and restricted stock are linked to stock performance creating alignment between executives and company shareholders. Options have no initial value and recipients only realize benefits if the value of our stock increases following the date of grant.
A majority of long-term compensation is equity-based (performance units, stock options, and restricted stock) and is tied to the future value of our common shares, further aligning the interests of our NEOs with our shareholders. All four components of long-term compensation are intended to focus executive behaviors on our long-term strategy. Each component is described in more detail below.
Amounts of long-term compensation awards issued and outstanding for the NEOs are set forth in the tables that follow this discussion and analysis.
Long-Term Incentive Plan Design
In contrast to the performance-based annual cash bonus plan, described above, which has approximately 13,000 participants, our performance-based Long-Term Incentive Plan has approximately 160 participants, including the NEOs. Each year we adopt a similar Long-Term Incentive Plan, which provides for overlapping three year performance periods. The Long-Term Incentive Plan consists of a performance-based long-term cash bonus and performance units which has the following characteristics:
| |
| |
| |
| |
| |
|
The Compensation Committee anticipates adopting a new Long-Term Incentive Plan each year, measuring improvement over successive three-year periods. Each year when establishing the performance metric baselines and percentage payouts per unit of improvement, the Compensation Committee considers the difficulty of achieving compounded improvement over time. During 2015, Kroger awarded 503,276 performance units to approximately 160 employees, including the NEOs.
24
Long-Term Incentive Plan Metrics and Connection to our Business Strategy
25
The following table summarizes the Long-Term Incentive Plans adopted for the years shown:
The Compensation Committee has made adjustments to the percentage payouts for the components of the Long-Term Incentive Plans over time to account for the increasing difficulty of achieving compounded improvement.
During 2015, Kroger awarded 503,276 performance units to approximately 160 employees, including the NEOs.
26
Results of 2013 Long-Term Incentive Plan
The 2013 Long-Term Incentive Plan, which measured improvements over the three year period from 2013 to 2015, paid out in March 2016 and was calculated as follows:
| Payout per | Percentage | ||||||||||||
| Improvement | Improvement | Earned | |||||||||||
| Metric | Baseline | Result(1) | (A) | (B) | (A) x (B) | ||||||||
| Customer 1st | 12 units of | ||||||||||||
| Strategy(2) | * | * | improvement | 2.00% | 24.00 | % | |||||||
| Improvement | |||||||||||||
| in Associate | 2 units of | ||||||||||||
| Engagement(2) | * | * | improvement | 4.00% | 8.00 | % | |||||||
| Reduction in Operating | |||||||||||||
| Cost as a Percentage | 56 basis point | ||||||||||||
| of Sales, without Fuel | 26.69% | 26.13% | improvement | 0.50% | 28.00 | % | |||||||
| Return on Invested | 66 basis point | ||||||||||||
| Capital | 13.27% | 13.93% | improvement | 1.00% | 66.00 | % | |||||||
| Total | 126.00 | % | |||||||||||
| Total Earned: Payout is | |||||||||||||
| capped at 100% | 100.00 | % | |||||||||||
Accordingly, each NEO received a long-term cash bonus in an amount equal to 100% of that executive’s long-term cash bonus potential, and was issued the number of Kroger common shares equal to 100% of the number of performance units awarded to that executive, along with a cash amount equal to the dividends paid on that number of common shares during the three year performance period. Payout for the cash components of the 2013 Long-Term Incentive Plan are reported in the “Non-Equity Incentive Plan Compensation” and “All Other Compensation” columns of the Summary Compensation Table and footnotes 4 and 6 to that table, and the common shares issued under the plan are reported in the 2015 Option Exercises and Stock Vested Table and footnote 2 to that table.
Stock Options and Restricted Stock
Stock options and restricted stock continue to play an important role in rewarding NEOs for the achievement of long-term business objectives and providing incentives for the creation of shareholder value.Awards based on Kroger’s common shares are granted annually to the NEOs and a large number of other employees. Kroger historically has distributed time-based equity awards widely, aligning the interests of employees with your interest as shareholders.
In 2015, Kroger granted 3,425,720 stock options to approximately 1,222 employees, including the NEOs. The options permit the holder to purchase Kroger common shares at an option price equal to the closing price of Kroger common shares on the date of the grant.
During 2015, Kroger awarded 3,228,270 shares of restricted stock to approximately 8,280 employees, including the NEOs.
Options are granted only on one of the four dates of Board meetings conducted after Kroger’s public release of its quarterly earnings results. The Compensation Committee determines the vesting schedule for stock options and restricted stock.
During 2015, the Compensation Committee granted to the NEOs: (a) stock options with a five-year vesting schedule; and (b) restricted stock with a three- or five-year vesting schedule.
27
As discussed below under Stock Ownership Guidelines, covered individuals, including the NEOs, must hold 100% of common shares issued pursuant to performance units earned, the shares received upon the exercise of stock options or upon the vesting of restricted stock, except those necessary to pay the exercise price of the options and/or applicable taxes, until applicable stock ownership guidelines are met, unless the disposition is approved in advance by the CEO, or by the Board or Compensation Committee for the CEO.
Retirement and Other Benefits
Kroger maintains a defined benefit and several defined contribution retirement plans for its employees. The NEOs participate in one or more of these plans, as well as one or more excess plans designed to make up the shortfall in retirement benefits created by limitations under the Internal Revenue Code on benefits to highly compensated individuals under qualified plans. Additional details regarding certain retirement benefits available to the NEOs can be found below in the 2015 Pension Benefits Table and the accompanying narrative description that follows this discussion and analysis.
Kroger also maintains an executive deferred compensation plan in which some of the NEOs participate. This plan is a nonqualified plan under which participants can elect to defer up to 100% of their cash compensation each year. Additional details regarding our nonqualified deferred compensation plans available to the NEOs can be found below in the Nonqualified Deferred Compensation Table and the accompanying narrative.
Kroger also maintains The Kroger Co. Employee Protection Plan (“KEPP”), which covers all of our management employees and administrative support personnel who have provided services to Kroger for at least one year and whose employment is not covered by a collective bargaining agreement. KEPP provides for severance benefits and extended Kroger-paid health care, as well as the continuation of other benefits as described in the plan, when an employee is actually or constructively terminated without cause within two years following a change in control of Kroger (as defined in KEPP). Participants are entitled to severance pay of up to 24 months’ salary and bonus. The actual amount is dependent upon pay level and years of service. KEPP can be amended or terminated by the Board at any time prior to a change in control.
Performance-based long-term cash bonus, performance unit, stock option, and restricted stock agreements with award recipients provide that those awards “vest,” with 50% of the long-term cash bonus potential being paid, common shares equal to 50% of the performance units being awarded, options becoming immediately exercisable, and restrictions on restricted stock lapsing upon a change in control as described in the grant agreements.
None of the NEOs is party to an employment agreement.
Perquisites
NEOs receive limited perquisites because the Compensation Committee does not believe that it is necessary for the attraction or retention of management talent to provide the NEOs a substantial amount of compensation in the form of perquisites. In 2015, the only perquisites available to our NEOs were:
| |
| |
|
Because he was an officer of Harris Teeter during 2015, Mr. Morganthall also was eligible for the following Harris Teeter perquisites:
| |
|
The total amount of perquisites furnished to the NEOs is shown in the Summary Compensation Table and described in more detail in footnote 6 to that table.
28
Process for Establishing Executive Compensation
The Compensation Committee of the Board has the primary responsibility for establishing the compensation of our executive officers, including the NEOs, with the exception of the Chief Executive Officer. The Compensation Committee’s role regarding the CEO’s compensation is to make recommendations to the independent members of the Board; those members of the Board establish the CEO’s compensation.
The Compensation Committee directly engages a compensation consultant from Mercer Human Resource Consulting to advise the Compensation Committee in the design of compensation for executive officers.
The Mercer consultant conducts an annual competitive assessment of executive positions at Kroger for the Compensation Committee. The assessment is one of several bases, as described above, on which the Compensation Committee determines compensation. The consultant assesses:
| |
| |
| |
| |
|
The consultant compares these elements against those of other companies in a group of publicly-traded food and drug retailers. For 2015, our peer group consisted of:
This peer group is the same group as was used in 2014. Median 2015 revenue for the peer group was $92.5 billion, compared to our revenue of $109.8 billion. The make-up of the compensation peer group is reviewed annually and modified as circumstances warrant. Industry consolidation and other competitive forces will result in changes to the peer group over time.
The consultant also provides the Compensation Committee data from “general industry” companies, a representation of major publicly-traded companies of similar size and scope from outside the retail industry. This data serves as reference points, particularly for senior staff positions where competition for talent extends beyond the retail sector.
Considering the size of Kroger in relation to other peer group companies, the Compensation Committee believes that salaries paid to our NEOs should be at or above the median paid by peer group companies for comparable positions. The Compensation Committee also aims to provide an annual cash bonus potential to our NEOs that, if the increasingly more challenging annual business plan objectives are achieved at superior levels, would cause total cash compensation to be meaningfully above the median. Actual payouts may be as low as zero if performance does not meet the baselines established by the Compensation Committee.
The independent members of the Board have the exclusive authority to determine the amount of the CEO’s compensation. In setting total compensation, the independent directors consider the median compensation of the peer group’s CEOs. With respect to the annual bonus, the independent directors make two determinations: (1) they determine the annual cash bonus potential that will be multiplied by the annual cash bonus payout percentage earned that is generally applicable to all corporate management, including the NEOs and (2) the independent directors determine the annual cash bonus amount paid to the CEO by retaining discretion to reduce the annual cash bonus percentage payout the CEO would otherwise receive under the formulaic plan.
29
The Compensation Committee performs the same function and exercises the same authority as to the other NEOs. In its annual review of compensation for the NEOs the Compensation Committee:
| |
| |
| |
|
In considering each of the factors above, the Compensation Committee does not make use of a formula, but rather quantitatively reviews each factor in setting compensation.
Advisory Vote to Approve Executive Compensation
At the 2015 annual meeting, we held our fifth annual advisory vote on executive compensation. Over 95% of the votes cast were in favor of the advisory proposal in 2015. The Compensation Committee believes it conveys our shareholders’ support of the Compensation Committee’s decisions and the existing executive compensation programs. As a result, the Compensation Committee made no material changes in the structure of our compensation programs or our pay for performance philosophy.
At the 2016 annual meeting, in keeping with our shareholders’ request for an annual advisory vote, we will again hold an advisory vote to approve executive compensation (see page 49). The Compensation Committee will continue to consider the results from this year’s and future advisory votes on executive compensation in their evaluation and administration of our compensation program.
Stock Ownership Guidelines
To more closely align the interests of our officers and directors with your interests as shareholders, the Board has adopted stock ownership guidelines. These guidelines require non-employee directors, executive officers, and other key executives to acquire and hold a minimum dollar value of Kroger common shares as set forth below:
30
Covered individuals are expected to achieve the target level within five years of appointment to their position. If the requirements are not met, individuals, including the NEOs, must hold 100% of common shares issued pursuant to performance units earned,shares received upon the exercise of stock options and upon the vesting of restricted stock, except those necessary to pay the exercise price of the options and/or applicable taxes, and must retain all Kroger shares unless the disposition is approved in advance by the CEO, or by the Board or Compensation Committee for the CEO.
Executive Compensation Recoupment Policy (Clawback)
If a material error of facts results in the payment to an executive officer at the level of Group Vice President or higher of an annual cash bonus or a long-term cash bonus in an amount higher than otherwise would have been paid, as determined by the Compensation Committee, then the officer, upon demand from the Compensation Committee, will reimburse Kroger for the amounts that would not have been paid if the error had not occurred. This recoupment policy applies to those amounts paid by Kroger within 36 months prior to the detection and public disclosure of the error. In enforcing the policy, the Compensation Committee will take into consideration all factors that it deems appropriate, including:
| |
| |
| |
|
Compensation Policies as They Relate to Risk Management
As part of the Compensation Committee’s review of our compensation practices, the Compensation Committee considers and analyzes the extent to which risks arise from such practices and their impact on Kroger’s business. As discussed in this discussion and analysis, our policies and practices for compensating employees are designed to, among other things, attract and retain high quality and engaged employees. In this process, the Compensation Committee also focuses on minimizing risk through the implementation of certain practices and policies, such as the executive compensation recoupment policy, which is described above under “Executive Compensation Recoupment Policy (Clawback)”. Accordingly, we do not believe that our compensation practices and policies create risks that are reasonably likely to have a material adverse effect on Kroger.
Prohibition on Hedging and Pledging
After considering best practices related to ownership of company shares, the Board has adopted a policy regarding hedging, pledging and short sales of Kroger securities. Kroger directors and officers are prohibited from engaging, directly or indirectly, in hedging transactions in, or short sales of, Kroger securities. In addition, the policy was further revised as of April 1, 2016, to preclude Kroger officers and directors from pledging Kroger securities.
Section 162(m) of the Internal Revenue Code
Tax laws place a deductibility limit of $1,000,000 on some types of compensation for the CEO and the next four most highly compensated officers (other than the chief financial officer) reported in this proxy because they are among the four highest compensated officers (“covered employees”). In Kroger’s case, this group of individuals is not identical to the group of NEOs. Compensation that is deemed to be “performance-based” is excluded for purposes of the calculation and is tax deductible. Awards under Kroger’s Long-Term Incentive Plans, when payable upon achievement of stated performance criteria, should be considered performance-based and the compensation paid under those plans should be tax deductible. Generally, compensation expense related to stock options awarded to the CEO and the next four most highly compensated officers should be deductible. On the other hand, Kroger’s awards of restricted stock that vest solely upon the passage of time are not performance-based. As a result,
31
compensation expense for those awards to the covered employees is not deductible, to the extent that the related compensation expense, plus any other expense for compensation that is not performance-based, exceeds $1,000,000.
Kroger’s bonus plans rely on performance criteria, which have been approved by shareholders. As a result, bonuses paid under the plans to the covered employees should be deductible by Kroger.
Kroger’s policy is, primarily, to design and administer compensation plans that support the achievement of long-term strategic objectives and enhance shareholder value. Where it is material and supports Kroger’s compensation philosophy, the Compensation Committee also will attempt to maximize the amount of compensation expense that is deductible by Kroger.
The Compensation Committee has reviewed and discussed with management of the Company the Compensation Discussion and Analysis contained in this proxy statement. Based on its review and discussions with management, the Compensation Committee has recommended to the Company’s Board that the Compensation Discussion and Analysis be included in the Company’s proxy statement and incorporated by reference into its Annual Report on Form 10-K.
Compensation Committee:
Clyde R. Moore, ChairJorge P. MontoyaSusan M. PhillipsJames A. Runde
32
Compensation Tables
Summary Compensation Table
The following table and footnotes provide information regarding the compensation of the NEOs for the fiscal years presented.
| Name and Principal Position(1) | Fiscal Year | Salary | Stock Awards ($)(2) | Option | Non-Equity Incentive Plan Compensation ($)(4) | Change in | All Other Compensation ($)(6) | Total ($) | ||||||||||||||
| W. Rodney McMullen | 2015 | 1,216,665 | 4,332,252 | 2,300,092 | 2,999,693 | 618,033 | 279,656 | 11,746,391 | ||||||||||||||
| Chairman and Chief | 2014 | 1,118,726 | 3,740,251 | 1,951,394 | 2,441,546 | 3,498,396 | 232,602 | 12,982,915 | ||||||||||||||
| Executive Officer | 2013 | 962,731 | 5,062,435 | 907,862 | 1,722,946 | 63,518 | 166,329 | 8,885,821 | ||||||||||||||
| J. Michael Schlotman | 2015 | 793,825 | 2,489,148 | 1,040,847 | 1,394,752 | 44,163 | 148,104 | 5,910,839 | ||||||||||||||
| Executive Vice President | 2014 | 745,313 | 1,490,700 | 520,372 | 1,103,750 | 1,922,821 | 113,922 | 5,896,878 | ||||||||||||||
| and Chief Financial | 2013 | 688,599 | 1,564,689 | 509,088 | 1,004,220 | — | 85,176 | 3,851,772 | ||||||||||||||
| Officer | ||||||||||||||||||||||
| Michael J. Donnelly | 2015 | 700,684 | 1,919,013 | 585,529 | 1,274,152 | 321,545 | 175,112 | 4,976,035 | ||||||||||||||
| Executive Vice President | 2014 | 651,315 | 748,051 | 390,279 | 1,024,261 | 341,775 | 100,305 | 3,255,986 | ||||||||||||||
| of Merchandising | 2013 | 565,136 | 1,099,201 | 236,283 | 803,052 | 3,744 | 81,557 | 2,778,973 | ||||||||||||||
| Christopher T. Hjelm | 2015 | 653,368 | 1,992,003 | 780,633 | 1,302,852 | 168 | 98,992 | 4,828,016 | ||||||||||||||
| Executive Vice President | ||||||||||||||||||||||
| and Chief Information | ||||||||||||||||||||||
| Officer | ||||||||||||||||||||||
| Frederick J. Morganthall II | 2015 | 619,944 | 1,595,918 | 390,414 | 1,453,450 | — | 297,335 | 4,357,061 | ||||||||||||||
| Executive Vice President | ||||||||||||||||||||||
| of Retail Operations | ||||||||||||||||||||||
| Name | Restricted Stock | Performance Units | ||||
| Mr. McMullen | $3,300,021 | $1,032,231 | ||||
| Mr. Schlotman | $1,979,946 | $509,202 | ||||
| Mr. Donnelly | $1,632,562 | $286,451 | ||||
| Mr. Hjelm | $1,610,062 | $381,941 | ||||
| Mr. Morganthall | $1,404,958 | $190,960 | ||||
The grant date fair value of the performance units reflected in the stock awards column and in the table above is computed based on the probable outcome of the performance conditions as of the grant date. This amount is consistent with the estimate of aggregate compensation cost to be recognized by the Company over the three-year performance period of the award determined as of the grant date under FASB ASC Topic 718, excluding the effect of estimated forfeitures. The assumptions used in calculating the valuations are set forth in Note 12 to the consolidated financial statements in Kroger’s 10-K for fiscal year 2015.
33
Assuming that the highest level of performance conditions is achieved, the aggregate fair value of the 2015 performance unit awards at the grant date is as follows:
| Value of Performance Units | |||||
| Name | Assuming Maximum Performance | ||||
| Mr. McMullen | $ | 2,064,462 | |||
Mr. Schlotman | $ | 1,018,403 | |||
| Mr. Donnelly | $ | 572,901 | |||
| Mr. Hjelm | $ | 763,881 | |||
| Mr. Morganthall | $ | 381,921 | |||
| Long-Term Cash | Harris Teeter | |||||||||||||
| Name | Annual Cash Bonus | Bonus | Merger Bonus | |||||||||||
| Mr. McMullen | $ | 2,060,093 | $ | 939,600 | N/A | |||||||||
| Mr. Schlotman | $ | 723,652 | $ | 671,100 | N/A | |||||||||
| Mr. Donnelly | $ | 723,652 | $ | 550,500 | N/A | |||||||||
| Mr. Hjelm | $ | 723,652 | $ | 579,200 | N/A | |||||||||
| Mr. Morganthall | $ | 645,010 | $ | 369,083 | $439,357 | |||||||||
In accordance with the terms of the 2015 performance-based annual cash bonus program, Kroger paid 126.7% of bonus potentials for the participants, including the NEOs. These amounts were earned with respect to performance in 2015 and paid in March 2016. Mr. Morganthall’s annual cash bonus payout was calculated by using the Harris Teeter formula for the 17 weeks he was a Harris Teeter officer and the Kroger formula for the remainder of the year when he was a Kroger officer.
The long-term cash bonus awarded under the 2013 Long-Term Incentive Plan is a performance-based bonus plan designed to reward participants for improving the long-term performance of the Company. The plan covered performance during fiscal years 2013, 2014 and 2015 and amounts earned under the plan were paid in March 2016. In accordance with the terms of the plan, participants earned and Kroger paid 100% of long-term cash bonus potentials. The long-term cash bonus potential equaled the participant’s salary in effect on the last day of fiscal 2012, and for Mr. Morganthall, the day he became eligible for the plan.
Amounts for Mr. Morganthall also include $439,357 for 2015 performance under The Harris Teeter Merger Cash Bonus Plan. This plan is a performance-based bonus plan designed to reward participants for achieving synergies over the three year period following the merger between Harris Teeter and Kroger, fiscal years 2014, 2015 and 2016. Payouts are made following the end of each fiscal year of amounts earned based on that year’s performance, subject to a maximum payout over the three-year period of 200% of the participant’s bonus potential. The bonus potential is equal to the participant’s salary in effect on the date of the merger. In March 2016, Mr. Morganthall received $439,357 for 2015 performance.
34
| Change in | Preferential Earnings on Nonqualified | ||||||||||
| Name | Pension Value | Deferred Compensation | |||||||||
| Mr. McMullen | $ | 537,941 | $ | 80,092 | |||||||
| Mr. Schlotman | $ | 44,163 | N/A | ||||||||
| Mr. Donnelly | $ | 316,969 | $ | 4,576 | |||||||
| Mr. Hjelm | $ | (1,142 | ) | $ | 168 | ||||||
| Mr. Morganthall | $ | (429,556 | ) | N/A | |||||||
The change in value of the accumulated pension benefit for each of Messrs. Hjelm and Morganthall are not included in the table because the value decreased.
Amounts reported for 2015 and 2014 include the change in the actuarial present value of accumulated pension benefits and preferential earnings on nonqualified deferred compensation. Amounts reported for 2013 include only preferential earnings on nonqualified deferred compensation because the changes in pension value were negative, which are not required to be reported in the table in accordance with SEC rules. Pension values may fluctuate significantly from year to year depending on a number of factors, including age, years of service, average annual earnings and the assumptions used to determine the present value, such as the discount rate. The change in the actuarial present value of accumulated pension benefits for 2014 was significantly greater than 2013 primarily due to a lower discount rate and revised mortality assumptions. The change in the actuarial present value of accumulated pension benefits for 2015 is primarily due to a lower discount rate. Please see the Pension Benefits section for further information regarding the assumptions used in calculating pension benefits.
Messrs. McMullen, Donnelly and Hjelm participate in Kroger’s nonqualified deferred compensation plan. Under the plan, deferred compensation earns interest at a rate representing Kroger’s cost of ten-year debt, as determined by the CEO and approved by the Compensation Committee prior to the beginning of each deferral year. For each participant, a separate deferral account is created each year and the interest rate established for that year is applied to that deferral account until the deferred compensation is paid out. If the interest rate established by Kroger for a particular year exceeds 120% of the applicable federal long-term interest rate that corresponds most closely to the plan rate, the amount by which the plan rate exceeds 120% of the corresponding federal rate is deemed to be above-market or preferential. In thirteen of the twenty-two years in which at least one NEO deferred compensation, the rate set under the plan for that year exceeds 120% of the corresponding federal rate. For each of the deferral accounts in which the plan rate is deemed to be above-market, Kroger calculates the amount by which the actual annual earnings on the account exceed what the annual earnings would have been if the account earned interest at 120% of the corresponding federal rate, and discloses those amounts as preferential earnings. Amounts deferred in 2015 earn interest at a rate lower than 120% of the corresponding federal rate; accordingly there are no preferential earnings on these amounts. In 2015, Mr. Morganthall participated in the Harris Teeter Supermarkets, Inc.Flexible Deferral Plan (the “HT Flexible Deferral Plan”), which does not provide above-market or preferential earnings on deferred compensation.
35
| Name | Life Insurance Premiums | Retirement Plan Contributions(a) | Payment of Dividend Equivalents on Earned Performance Units | Dividends Paid on Unvested Restricted Stock | Other(b) | ||||||||||||||||||
| Mr. McMullen | $ | 76,340 | — | $ | 50,791 | $ | 152,525 | — | |||||||||||||||
| Mr. Schlotman | $ | 60,878 | — | $ | 28,481 | $ | 58,745 | — | |||||||||||||||
| Mr. Donnelly | $ | 54,525 | $ | 69,169 | $ | 13,219 | $ | 38,199 | — | ||||||||||||||
| Mr. Hjelm | $ | 36,781 | $ | 12,867 | $ | 13,219 | $ | 36,125 | — | ||||||||||||||
| Mr. Morganthall | $ | 20,940 | $ | 34,466 | $ | 6,689 | $ | 61,583 | $ | 173,657 | |||||||||||||
36
2015 Grants of Plan-Based Awards
The following table provides information about equity and non-equity incentive awards granted to the NEOs in 2015.
| Name | Grant Date | Estimated Future Payouts Under Non-Equity Incentive Plan Awards | Estimated Future Payouts Under Equity Incentive Plan Awards | All Other Stock Awards: Number of Shares of Stock or Units (#)(4) | All Other Option Awards: Number of Securities Underlying Options (#)(5) | Exercise or Base Price of Option Awards ($/Sh) | Grant Date Fair Value of Stock and Option Awards | |||||||||||||||||||||||||
| Target ($) | Maximum ($) | Target | Maximum | |||||||||||||||||||||||||||||
| W. Rodney | $ | 1,625,962 | (1) | $ | 3,251,924 | (1) | ||||||||||||||||||||||||||
| McMullen | $ | 600,000 | (2) | $ | 1,200,000 | (2) | ||||||||||||||||||||||||||
| 7/15/2015 | 86,095 | $ | 3,300,021 | |||||||||||||||||||||||||||||
| 7/15/2015 | 235,415 | $ | 38.33 | $ | 2,300,092 | |||||||||||||||||||||||||||
| 7/15/2015 | 26,090 | (3) | 52,179 | (3) | $ | 1,032,231 | ||||||||||||||||||||||||||
| J. Michael | $ | 571,154 | (1) | $ | 1,142,308 | (1) | ||||||||||||||||||||||||||
| Schlotman | $ | 380,000 | (2) | $ | 760,000 | (2) | ||||||||||||||||||||||||||
| 7/15/2015 | 38,610 | $ | 1,479,921 | |||||||||||||||||||||||||||||
| 9/17/2015 | 13,334 | $ | 500,025 | |||||||||||||||||||||||||||||
| 7/15/2015 | 106,531 | $ | 38.33 | $ | 1,040,847 | |||||||||||||||||||||||||||
| 7/15/2015 | 12,870 | (3) | 25,740 | (3) | $ | 509,202 | ||||||||||||||||||||||||||
| Michael J. | $ | 571,154 | (1) | $ | 1,142,308 | (1) | ||||||||||||||||||||||||||
| Donnelly | $ | 331,450 | (2) | $ | 662,900 | (2) | ||||||||||||||||||||||||||
| 7/15/2015 | 29,547 | $ | 1,132,537 | |||||||||||||||||||||||||||||
| 9/17/2015 | 13,334 | $ | 500,025 | |||||||||||||||||||||||||||||
| 7/15/2015 | 59,929 | $ | 38.33 | $ | 585,529 | |||||||||||||||||||||||||||
| 7/15/2015 | 7,240 | (3) | 14,480 | (3) | $ | 286,451 | ||||||||||||||||||||||||||
| Christopher T. | $ | 571,154 | (1) | $ | 1,142,308 | (1) | ||||||||||||||||||||||||||
| Hjelm | $ | 310,000 | (2) | $ | 620,000 | (2) | ||||||||||||||||||||||||||
| 7/15/2015 | 28,960 | $ | 1,110,037 | |||||||||||||||||||||||||||||
| 9/17/2015 | 13,334 | $ | 500,025 | |||||||||||||||||||||||||||||
| 7/15/2015 | 79,898 | $ | 38.33 | $ | 780,633 | |||||||||||||||||||||||||||
| 7/15/2015 | 9,654 | (3) | 19,307 | (3) | $ | 381,941 | ||||||||||||||||||||||||||
| Frederick J. | $ | 577,769 | (1) | $ | 1,155,538 | (1) | ||||||||||||||||||||||||||
| Morganthall II | $ | 285,117 | (2) | $ | 570,234 | (2) | ||||||||||||||||||||||||||
| 7/15/2015 | 23,609 | $ | 904,933 | |||||||||||||||||||||||||||||
| 9/17/2015 | 13,334 | $ | 500,025 | |||||||||||||||||||||||||||||
| 7/15/2015 | 39,959 | $ | 38.33 | $ | 390,414 | |||||||||||||||||||||||||||
| 7/15/2015 | 4,827 | (3) | 9,653 | (3) | $ | 190,960 | ||||||||||||||||||||||||||
37
The Compensation Committee, and the independent members of the Board in the case of the CEO, established the bonus potentials shown in this table as “Target” amounts for the performance-based annual cash bonus awards, and established the amounts shown in this table as “Maximum” amounts for the long-term cash bonus awards and the performance unit awards. Amounts are payable to the extent that performance meets specific performance goals established by the Compensation Committee at the beginning of the performance period. As described in the Compensation Discussion and Analysis, actual earnings under the annual performance-based cash bonus plan may exceed the target amount if the Company’s performance exceeds the performance goals, but are limited to 200% of the target amount. The Compensation Committee, and the independent members of the Board in the case of the CEO, also determined the number of performance units to be awarded to each NEO, under which common shares are earned to the extent performance meets specific objectives established at the beginning of the performance period. The performance units and the long-term cash bonus awards are more particularly described in the Compensation Discussion and Analysis.
Restrictions on restricted stock awarded to the NEOs normally lapse, so long as the officer is then in our employ, in equal amounts on each of the first five anniversaries of the grant date, except that the awards granted to Messrs. Schlotman, Donnelly, Hjelm and Morganthall on 9/17/2015 and 9,132 shares of the award granted to Mr. Morganthall on 7/15/15 vest in equal amounts on each of the first three anniversaries of the grant date. Any dividends declared on Kroger common shares are payable on unvested restricted stock. Nonqualified stock options granted to the NEOs normally vest, so long as the officer is then in our employ, in equal amounts on each of the first five anniversaries of the grant date.
38
2015 Outstanding Equity Awards at Fiscal Year-End
The following table provides information about outstanding equity-based incentive compensation awards for the NEOs as of the end of 2015. The vesting schedule for each award is described in the footnotes to this table. The market value of unvested restricted stock and unearned performance units is based on the closing price of Kroger’s common shares of $38.81 on January 29, 2016, the last trading day of 2015.
| Option Awards | Stock Awards | |||||||||||||||||||||||||||||||||||||
| Name | Number of Securities Underlying Unexercised Options Exercisable (#) | Number of | Option | Option Expiration Date | Number of Shares or Units of Stock That Have Not Vested (#) | Market Value | Equity Incentive Plan Awards: Number of Unearned Shares, Units or Other Rights That Have Not Vested (#) | Equity | ||||||||||||||||||||||||||||||
| W. Rodney | 120,000 | — | $ | 9.97 | 5/4/2016 | 13,716 | (6) | 532,318 | 73,875 | (16) | 2,952,414 | (16) | ||||||||||||||||||||||||||
| McMullen | 120,000 | — | $ | 14.14 | 6/28/2017 | 29,232 | (7) | 1,134,494 | 26,090 | (17) | 1,044,754 | (17) | ||||||||||||||||||||||||||
| 130,000 | — | $ | 14.31 | 6/26/2018 | 43,848 | (8) | 1,701,741 | |||||||||||||||||||||||||||||||
| 130,000 | — | $ | 11.17 | 6/25/2019 | 96,000 | (9) | 3,725,760 | |||||||||||||||||||||||||||||||
| 140,000 | — | $ | 10.08 | 6/24/2020 | 90,000 | (10) | 3,492,900 | |||||||||||||||||||||||||||||||
| 146,304 | 36,576 | (1) | $ | 12.37 | 6/23/2021 | 86,095 | (11) | 3,341,347 | ||||||||||||||||||||||||||||||
| 116,928 | 77,952 | (2) | $ | 10.98 | 7/12/2022 | |||||||||||||||||||||||||||||||||
| 77,952 | 116,928 | (3) | $ | 18.88 | 7/15/2023 | |||||||||||||||||||||||||||||||||
| 60,000 | 240,000 | (4) | $ | 24.67 | 7/15/2024 | |||||||||||||||||||||||||||||||||
| — | 235,415 | (5) | $ | 38.33 | 7/15/2025 | |||||||||||||||||||||||||||||||||
| J. Michael | 50,000 | — | $ | 10.08 | 6/24/2020 | 6,846 | (6) | 265,693 | 19,700 | (16) | 787,311 | (16) | ||||||||||||||||||||||||||
| Schlotman | 73,024 | 18,256 | (1) | $ | 12.37 | 6/23/2021 | 16,392 | (7) | 636,174 | 12,870 | (17) | 515,379 | (17) | |||||||||||||||||||||||||
| 65,568 | 43,712 | (2) | $ | 10.98 | 7/12/2022 | 24,588 | (8) | 954,260 | ||||||||||||||||||||||||||||||
| 43,712 | 65,568 | (3) | $ | 18.88 | 7/15/2023 | 13,000 | (12) | 504,530 | ||||||||||||||||||||||||||||||
| 16,000 | 64,000 | (4) | $ | 24.67 | 7/15/2024 | 16,000 | (13) | 620,960 | ||||||||||||||||||||||||||||||
| — | 106,531 | (5) | $ | 38.33 | 7/15/2025 | 24,000 | (10) | 931,440 | ||||||||||||||||||||||||||||||
| 38,610 | (11) | 1,498,454 | ||||||||||||||||||||||||||||||||||||
| 13,334 | (14) | 517,493 | ||||||||||||||||||||||||||||||||||||
| Michael J. | 40,000 | — | $ | 14.14 | 6/28/2017 | 4,804 | (6) | 186,443 | 14,775 | (16) | 590,483 | (16) | ||||||||||||||||||||||||||
| Donnelly | 40,000 | — | $ | 14.31 | 6/26/2018 | 7,608 | (7) | 295,266 | 7,240 | (17) | 289,926 | (17) | ||||||||||||||||||||||||||
| 40,000 | — | $ | 11.17 | 6/25/2019 | 14,412 | (8) | 559,330 | |||||||||||||||||||||||||||||||
| 40,000 | — | $ | 10.08 | 6/24/2020 | 13,000 | (12) | 504,530 | |||||||||||||||||||||||||||||||
| 56,576 | 14,144 | (1) | $ | 12.37 | 6/23/2021 | 18,000 | (10) | 698,580 | ||||||||||||||||||||||||||||||
| 30,432 | 20,288 | (2) | $ | 10.98 | 7/12/2022 | 29,547 | (11) | 1,146,719 | ||||||||||||||||||||||||||||||
| 20,288 | 30,432 | (3) | $ | 18.88 | 7/15/2023 | 13,334 | (14) | 517,493 | ||||||||||||||||||||||||||||||
| 12,000 | 48,000 | (4) | $ | 24.67 | 7/15/2024 | |||||||||||||||||||||||||||||||||
| — | 59,929 | (5) | $ | 38.33 | 7/15/2025 | |||||||||||||||||||||||||||||||||
| Christopher T. | 8,000 | — | $ | 14.31 | 6/26/2018 | 3,804 | (6) | 147,633 | 14,775 | (16) | 590,483 | (16) | ||||||||||||||||||||||||||
| Hjelm | 16,000 | — | $ | 11.17 | 6/25/2019 | 7,608 | (7) | 295,266 | 9,654 | (17) | 386,574 | (17) | ||||||||||||||||||||||||||
| 24,000 | — | $ | 10.08 | 6/24/2020 | 11,412 | (8) | 442,900 | |||||||||||||||||||||||||||||||
| 30,432 | 10,144 | (1) | $ | 12.37 | 6/23/2021 | 13,000 | (12) | 504,530 | ||||||||||||||||||||||||||||||
| 30,432 | 20,288 | (2) | $ | 10.98 | 7/12/2022 | 18,000 | (10) | 698,580 | ||||||||||||||||||||||||||||||
| 20,288 | 30,432 | (3) | $ | 18.88 | 7/15/2023 | 28,960 | (11) | 1,123,938 | ||||||||||||||||||||||||||||||
| 12,000 | 48,000 | (4) | $ | 24.67 | 7/15/2024 | 13,334 | (14) | 517,493 | ||||||||||||||||||||||||||||||
| — | 79,898 | (5) | $ | 38.33 | 7/15/2025 | |||||||||||||||||||||||||||||||||
| Frederick J. | — | 39,959 | (5) | $ | 38.33 | 7/15/2025 | 75,778 | (15) | 2,940,944 | 13,445 | (16) | 537,339 | (16) | |||||||||||||||||||||||||
| Morganthall II | 34,710 | (10) | 1,347,095 | 4,827 | (17) | 193,277 | (17) | |||||||||||||||||||||||||||||||
| 9,132 | (8) | 354,413 | ||||||||||||||||||||||||||||||||||||
| 14,477 | (11) | 561,852 | ||||||||||||||||||||||||||||||||||||
| 13,334 | (14) | 517,493 | ||||||||||||||||||||||||||||||||||||
39
2015 Option Exercises and Stock Vested
The following table provides information for 2015 regarding stock options exercised, restricted stock vested, and common shares issued to the NEOs pursuant to performance units earned under the 2013 Long-Term Incentive Plan.
| Option Awards(1) | Stock Awards(2) | |||||||||||||||||
| Name | Number of Shares Acquired on Exercise (#) | Value Realized on Exercise ($) | Number of Shares Acquired on Vesting (#) | Value Realized on Vesting ($) | ||||||||||||||
| W. Rodney McMullen | 150,000 | $ | 4,141,875 | 156,668 | $ | 6,019,970 | ||||||||||||
| J. Michael Schlotman | — | — | 70,808 | $ | 2,696,280 | |||||||||||||
| Michael J. Donnelly | 36,000 | $ | 1,124,280 | 43,426 | $ | 1,668,288 | ||||||||||||
| Christopher T. Hjelm | — | — | 41,426 | $ | 1,593,233 | |||||||||||||
| Frederick J. Morganthall II | — | — | 43,034 | $ | 1,656,157 | |||||||||||||
40
| Vested Restricted Stock | Earned Performance Units | |||||||||||||
| Name | Number of Shares | Value Realized | Number of Shares | Value Realized | ||||||||||
| Mr. McMullen | 107,948 | $ | 4,181,764 | 48,720 | $ | 1,838,206 | ||||||||
| Mr. Schlotman | 43,488 | $ | 1,665,496 | 27,320 | $ | 1,030,784 | ||||||||
| Mr. Donnelly | 30,746 | $ | 1,189,872 | 12,680 | $ | 478,416 | ||||||||
| Mr. Hjelm | 28,746 | $ | 1,114,817 | 12,680 | $ | 478,416 | ||||||||
| Mr. Morganthall | 33,934 | $ | 1,312,814 | 9,100 | $ | 343,343 | ||||||||
Restricted stock. The table includes the number of shares acquired upon vesting of restricted stock and the value realized on the vesting of restricted stock.
Performance Units. In 2013, participants in the 2013 Long-Term Incentive Plan were awarded performance units that were earned based on performance criteria established by the Compensation Committee at the beginning of the three-year performance period. Actual payouts were based on the level of performance achieved, and were paid in common shares. The number of common shares issued and the value realized based on the closing price of Kroger common shares of $37.73 on March 10, 2016, the date of deemed delivery of the shares, are reflected in the table above.
2015 Pension Benefits
The following table provides information regarding pension benefits for the NEOs as of the last day of 2015.
| Name | Plan Name | Number of Years Credited Service (#) | Present Value of Accumulated Benefit ($)(1) | ||||||||
| W. Rodney McMullen | Kroger Consolidated Retirement Benefit Plan | 30 | $ | 1,070,880 | |||||||
| Kroger Excess Benefit Plan | 30 | $ | 10,276,024 | ||||||||
| J. Michael Schlotman | Kroger Consolidated Retirement Benefit Plan | 30 | $ | 1,169,438 | |||||||
| Kroger Excess Benefit Plan | 30 | $ | 5,457,400 | ||||||||
| Michael J. Donnelly | Kroger Consolidated Retirement Benefit Plan | 36 | $ | 244,532 | |||||||
| Kroger Excess Benefit Plan | 36 | $ | 3,241,033 | ||||||||
| Christopher T. Hjelm | Kroger Consolidated Retirement Benefit Plan | — | (2) | $ | 10,086 | ||||||
| Frederick J. Morganthall II | Harris Teeter Employees’ Pension Plan | 29 | $ | 975,455 | |||||||
| Harris Teeter Supplemental Executive | |||||||||||
| Retirement Plan | 29 | $ | 8,044,875 | ||||||||
41
Kroger Pension Plan and Excess Plan
Messrs. McMullen, Schlotman, Donnelly and Hjelm participate in The Kroger Consolidated Retirement Benefit Plan (the “Kroger Pension Plan”), which is a qualified defined benefit pension plan. Messrs. McMullen, Schlotman and Donnelly also participate in The Kroger Co. Excess Benefit Plan (the “Excess Plan”), which is a nonqualified deferred compensation plan as defined in Section 409A of the Internal Revenue Code. The purpose of the Excess Plan is to make up the shortfall in retirement benefits caused by the limitations on benefits to highly compensated individuals under the qualified defined benefit pension plans in accordance with the Internal Revenue Code.
Although participants generally receive credited service beginning at age 21, certain participants in the Kroger Pension Plan and the Excess Plan who commenced employment prior to 1986, including Messrs. McMullen and Schlotman, began to accrue credited service after attaining age 25 and one year of service. The Kroger Pension Plan and the Excess Plan generally determine accrued benefits using a cash balance formula, but retain benefit formulas applicable under prior plans for certain “grandfathered participants” who were employed by Kroger on December 31, 2000. Each of Messrs. McMullen, Schlotman and Donnelly is eligible for these grandfathered benefits. Mr. Hjelm is not a grandfathered participant, and therefore, his benefits are determined using the cash balance formula.
Grandfathered Participants
Benefits for grandfathered participants are determined using formulas applicable under prior plans, including the Kroger formula covering service to The Kroger Co. and the Dillon formula covering service to Dillon Companies, Inc. As “grandfathered participants”, Messrs. McMullen, Schlotman and Donnelly will receive benefits under the Kroger Pension Plan and the Excess Plan, determined as follows:
| |
| |
| |
|
In the event of a termination of employment other than death or disability, Messrs. McMullen, Schlotman and Donnelly currently are eligible for a reduced early retirement benefit, as each has attained age 55. If a “grandfathered participant” becomes disabled while employed by Kroger and after attaining age 55, the participant will receive the full retirement benefit. If a married “grandfathered participant” dies while employed by Kroger, the surviving spouse will receive benefits as though a retirement occurred on such date, based on the greater of: actual benefits payable to the participant if he was over age 55, or the benefits that would have been payable to the participant assuming he was age 55 on the date of death.
Cash Balance Participants
Mr. Hjelm began participating in the Kroger Pension Plan in August 2005 as a cash balance participant. Until the plan was frozen on December 31, 2006, cash balance participants received an annual pay credit equal to 5% of that year’s eligible earnings plus an annual interest credit equal to the account balance at the beginning of the plan year multiplied by the annual rate of interest on 30-year Treasury Securities in effect prior to the plan year. Beginning on January 1, 2007, cash balance participants receive an annual interest credit but no longer receive an annual pay credit. Upon retirement, cash balance participants generally are eligible to receive a life annuity which is the actuarial equivalent of his account balance, but may elect in some circumstances to receive a lump sum distribution equal to his account balance. If Mr. Hjelm becomes disabled while employed by Kroger, he will receive the full retirement benefit. If he dies while employed by Kroger, his beneficiary will receive a death benefit equal to the benefit he was eligible to receive if a retirement occurred on such date.
42
Offsetting Benefits
Mr. Donnelly also participates in the Dillon Companies, Inc. Employees’ Profit Sharing Plan, which is a qualified defined contribution plan (the “Dillon Profit Sharing Plan”) under which Dillon Companies, Inc. and its participating subsidiaries may choose to make discretionary contributions each year that are allocated to each participant’s account. Participation in Dillon Profit Sharing Plan was frozen in 2001 and participants are no longer able to make employee contributions, but certain participants, including Mr. Donnelly, are still eligible for employer contributions. Participants elect from among a number of investment options and the amounts in their accounts are invested and credited with investment earnings in accordance with their elections. Due to offset formulas contained in the Kroger Pension Plan, Mr. Donnelly’s accrued benefits under the Dillon Profit Sharing Plan offset a portion of the benefit that would otherwise accrue for him under the Kroger Pension for his service with Dillon Companies, Inc. This offset is reflected in the table above.
Harris Teeter Pension Plan
Mr. Morganthall participates in the HT Pension Plan, which is a defined benefit pension plan. Participation in the HT Pension Plan was frozen effective October 1, 2005. For participants with age and service points as of December 31, 2005 equal to or greater than 45, which includes Mr. Morganthall, benefit accruals under the HT Pension Plan after September 30, 2005 will be offset by the actuarial equivalent of the portion of their account balance under the Harris Teeter Supermarkets, Inc. Retirement and Savings Plan (the “HT Savings Plan”) that are attributable to automatic retirement contributions made by Harris Teeter after September 30, 2005, plus earnings and losses on such contributions. A participant’s normal annual retirement benefit under the HT Pension Plan at age 65 is an amount equal to 0.8% of his final average earnings multiplied by years of service at retirement, plus 0.6% of his final average earnings in excess of Social Security covered compensation multiplied by the number of years of service up to a maximum of 35 years. A participant’s final average earnings is the average annual cash compensation paid to the participant during the plan year, including salary, incentive compensation and any amount contributed to the HT Savings Plan, for the 5 consecutive years in the last 10 years that produce the highest average.
Harris Teeter SERP
Mr. Morganthall also participates in the HT SERP, which is a nonqualified deferred compensation plan as defined in Section 409A of the Internal Revenue Code. The purpose of the HT SERP is to supplement the benefits payable under the retirement plans. Under the HT SERP, participants who retire at normal retirement age of 60 receive monthly retirement benefits equal to between 55% and 60% of his final average earnings times his accrual fraction and reduced by his (1) assumed HT Pension Plan retirement benefit, and (2) assumed Social Security benefit. The final average earnings are the average annual earnings during the highest 3 calendar years out of the last 10 calendar years preceding termination of employment. The accrual fraction is a fraction, the numerator of which is the years of credited service, the denominator of which is 20, and which may not exceed 1.0. The benefits payable under the HT SERP are payable for the participant’s lifetime with an automatic 75% survivor benefit payable to the participant’s surviving eligible spouse for his or her lifetime. Mr. Morganthall is eligible to receive the full benefit as he has reached age 60. Harris Teeter uses a non-qualified trust to purchase and hold the assets to satisfy Harris Teeter’s obligation under the HT SERP, and participants in the HT SERP are general creditors of Harris Teeter in the event Harris Teeter becomes insolvent.
43
2015 Nonqualified Deferred Compensation
The following table provides information on nonqualified deferred compensation for the NEOs for 2015.
| Name | Executive Contributions in Last FY | Registrant Contributions in Last FY | Aggregate Earnings in Last FY(1) | Aggregate Balance at Last FYE(2) | ||||||||||||||||||
| W. Rodney McMullen | $ | 7,500 | (3) | — | $ | 532,896 | $ | 8,379,170 | ||||||||||||||
| J. Michael Schlotman | — | — | — | — | ||||||||||||||||||
| Michael J. Donnelly | — | — | $ | 24,430 | $ | 372,649 | ||||||||||||||||
| Christopher T. Hjelm | $ | 148,808 | (4) | — | $ | 10,053 | $ | 236,885 | ||||||||||||||
| Frederick J. Morganthall II | $ | 100,000 | (4) | $ | 13,475 | (5) | — | $ | 663,852 | |||||||||||||
Kroger Executive Deferred Compensation Plan
Messrs. McMullen, Donnelly and Hjelm participate in The Kroger Co. Executive Deferred Compensation Plan, which is a nonqualified deferred compensation plan. Participants may elect to defer up to 100% of the amount of their salary that exceeds the sum of the FICA wage base and pre-tax insurance and other Internal Revenue Code Section 125 plan deductions, as well as up to 100% of their annual and long-term cash bonus compensation. Kroger does not match any deferral or provide other contributions. Deferral account amounts are credited with interest at the rate representing Kroger’s cost of ten-year debt as determined by Kroger’s CEO and approved by the Compensation Committee prior to the beginning of each deferral year. The interest rate established for deferral amounts for each deferral year will be applied to those deferral amounts for all subsequent years until the deferred compensation is paid out. Amounts deferred in 2015 earn interest at a rate of 3.65%. Participants can elect to receive lump sum distributions or quarterly installments for periods up to ten years. Participants also can elect between lump sum distributions and quarterly installments to be received by designated beneficiaries if the participant dies before distribution of deferred compensation is completed.
Participants may not withdraw amounts from their accounts until they leave Kroger, except that Kroger has discretion to approve an early distribution to a participant upon the occurrence of an unforeseen emergency. Participants who are “specified employees” under Section 409A of the Internal Revenue Code, which includes the NEOs, may not receive a post-termination distribution for at least six months following separation. If the employee dies prior to or during the distribution period, the remainder of the account will be distributed to his designated beneficiary in lump sum or quarterly installments, according to the participant’s prior election.
44
Harris Teeter Flexible Deferral Plan
Mr. Morganthall participates in the HT Flexible Deferral Plan, which is a nonqualified deferred compensation plan that provides certain highly compensated employees of Harris Teeter, the opportunity to defer the receipt and taxation on a portion of their annual compensation and supplements the benefits under tax qualified retirement plans to the extent that such benefits are subject to limitation under the Internal Revenue Code. Participants may elect to defer up to 50% of their base salary and up to 90% of their non-equity incentive bonus compensation. Harris Teeter provides matching contributions of 50% of the participant’s contribution, up to a maximum of 4% of the participant’s pay, less assumed matching contributions under the HT Savings Plan. These deferred amounts and Company match are credited to the participant’s account. Plan participants may choose deemed investments in the HT Flexible Deferral Plan that represent choices that span a variety of diversified asset classes. Participants may elect to receive a lump sum distribution, annual installment payments for 2-15 years, or a partial lump sum and installment payments. Upon retirement, death, disability, or other separation of service, the participant will receive distributions in accordance with his election, subject to limitations under Section 409A. Mr. Morganthall has reached the retirement age and is eligible for the full benefit. The HT Flexible Deferral Plan also allows for an in-service withdrawal for an unforeseeable emergency based on facts and circumstances that meet Internal Revenue Service and plan guidelines. Harris Teeter uses a non-qualified trust to purchase and hold the assets to satisfy Harris Teeter’s obligation under the HT Flexible Deferral Plan, and participants in the HT Flexible Deferral Plan are general creditors of Harris Teeter in the event Harris Teeter becomes insolvent.
Potential Payments upon Termination or Change in Control
Kroger does not have employment agreements or other contracts, agreements, plans or arrangements that provide for payments to the NEOs in connection with a termination of employment or a change in control of Kroger. However, KEPP, our award agreements for stock options, restricted stock and performance units and our long-term cash bonus plans provide for certain payments and benefits to participants, including the NEOs, in the event of a termination of employment or a change in control of Kroger, as described below. Our pension plans and nonqualified deferred compensation plan also provide for certain payments and benefits to participants in the event of a termination of employment, as described above in the Pension Benefits section and the Nonqualified Deferred Compensation section, respectively.
A “change in control” under KEPP, and our equity and non-equity incentive awards occurs if:
| |
| |
| |
|
KEPP
KEPP applies to all management employees and administrative support personnel who are not covered by a collective bargaining agreement, with at least one year of service, and provides severance benefits when a participant’s employment is terminated actually or constructively within two years following a change in control of Kroger, including the NEOs. The actual amount is dependent on pay level and years of service. The NEOs are eligible for the following benefits:
|
45
| |
| |
| |
|
Payments to executive officers under KEPP will be reduced, to the extent necessary, so that payments will not exceed 2.99 times the officer’s average W-2 earnings over the preceding five years.
Long-Term Compensation Awards
The following table describes the treatment of long-term2017 compensation awards following a termination of employment or change in control of Kroger. In each case, the continued vesting, exercisability or eligibility for the incentive awards will end if the participant provides services to a competitor of Kroger.
|
|
|
|
| |||
|
|
|
|
| |||
|
|
|
|
| |||
|
|
|
|
| |||
|
|
|
|
| |||
|
|
|
|
|
46
Quantification of Payments upon Termination or Change in Control
The following table provides information regarding certain potential payments that would have been made to the NEOs if the triggering event occurred on the last day of the fiscal year, January 30, 2016, given compensation, age and service levels as of that date and, where applicable, based on the closing market price per Kroger common share on the last trading day of the fiscal year ($38.81 on January 29, 2016). Amounts actually received upon the occurrence of a triggering event will vary based on factors such as the timing during the year of such event, the market price of Kroger common shares, and the officer’s age, length of service and compensation levels.
| Name | Involuntary Termination | Voluntary Termination/ Retirement | Death | Disability | Change in Control without Termination | Change in | ||||||||||||||||
| W. Rodney McMullen | ||||||||||||||||||||||
| Accrued and Banked Vacation | $ | 763,072 | $ | 763,072 | $ | 763,072 | $ | 763,072 | $ | 763,072 | $ | 763,072 | ||||||||||
| Severance | — | — | — | — | — | 4,790,016 | ||||||||||||||||
| Additional Vacation and Bonus | — | — | — | — | — | 108,173 | ||||||||||||||||
| Continued Health and Welfare Benefits(1) | — | — | — | — | — | 58,326 | ||||||||||||||||
| Stock Options(2) | — | — | 8,973,448 | 8,973,448 | 8,973,448 | 8,973,448 | ||||||||||||||||
| Restricted Stock(3) | — | — | 13,928,560 | 13,928,560 | 13,928,560 | 13,928,560 | ||||||||||||||||
| Performance Units(4) | — | 2,615,463 | 2,615,463 | 2,615,463 | 2,467,908 | 2,467,908 | ||||||||||||||||
| Long-Term Cash Bonus(5) | — | 1,133,340 | 1,133,340 | 1,133,340 | 1,150,000 | 1,150,000 | ||||||||||||||||
| Executive Group Life Insurance | — | — | 4,910,000 | — | — | — | ||||||||||||||||
| J. Michael Schlotman | ||||||||||||||||||||||
| Accrued and Banked Vacation | $ | 516,928 | $ | 516,928 | $ | 516,928 | $ | 516,928 | $ | 516,928 | $ | 516,928 | ||||||||||
| Severance | — | — | — | — | — | 2,581,080 | ||||||||||||||||
| Additional Vacation and Bonus | — | — | — | — | — | 45,622 | ||||||||||||||||
| Continued Health and Welfare Benefits(1) | — | — | — | — | — | 48,995 | ||||||||||||||||
| Stock Options(2) | — | — | 3,962,059 | 3,962,059 | 3,962,059 | 3,962,059 | ||||||||||||||||
| Restricted Stock(3) | — | — | 5,929,004 | 5,929,004 | 5,929,004 | 5,929,004 | ||||||||||||||||
| Performance Units(4) | — | 850,471 | 850,471 | 850,471 | 887,585 | 887,585 | ||||||||||||||||
| Long-Term Cash Bonus(5) | — | 743,335 | 743,335 | 743,335 | 747,500 | 747,500 | ||||||||||||||||
| Executive Group Life Insurance | — | — | 3,064,200 | — | — | — | ||||||||||||||||
| Michael J. Donnelly | ||||||||||||||||||||||
| Accrued and Banked Vacation | $ | 245,191 | $ | 245,191 | $ | 245,191 | $ | 245,191 | $ | 245,191 | $ | 245,191 | ||||||||||
| Severance | — | — | — | — | — | 2,345,731 | ||||||||||||||||
| Additional Vacation and Bonus | — | — | — | — | — | 42,451 | ||||||||||||||||
| Continued Health and Welfare Benefits(1) | — | — | — | — | — | 38,794 | ||||||||||||||||
| Stock Options(2) | — | — | 2,252,578 | 2,252,578 | 2,252,578 | 2,252,578 | ||||||||||||||||
| Restricted Stock(3) | — | — | 3,908,361 | 3,908,361 | 3,908,361 | 3,908,361 | ||||||||||||||||
| Performance Units(4) | — | 575,422 | 575,422 | 575,422 | 572,059 | 572,059 | ||||||||||||||||
| Long-Term Cash Bonus(5) | — | 650,008 | 650,008 | 650,008 | 653,230 | 653,230 | ||||||||||||||||
| Executive Group Life Insurance | — | — | 2,770,000 | — | — | — | ||||||||||||||||
| Christopher T. Hjelm | ||||||||||||||||||||||
| Accrued and Banked Vacation | $ | 53,848 | $ | 53,848 | $ | 53,848 | $ | 53,848 | $ | 53,848 | $ | 53,848 | ||||||||||
| Severance | — | — | — | — | — | 2,053,342 | ||||||||||||||||
| Additional Vacation and Bonus | — | — | — | — | — | 39,487 | ||||||||||||||||
| Continued Health and Welfare Benefits(1) | — | — | — | — | — | 48,101 | ||||||||||||||||
| Stock Options(2) | — | — | 2,156,403 | 2,156,403 | 2,156,403 | 2,156,403 | ||||||||||||||||
| Restricted Stock(3) | — | — | 3,730,340 | 3,730,340 | 3,730,340 | 3,730,340 | ||||||||||||||||
| Performance Units(4) | — | 637,879 | 637,879 | 637,879 | 665,727 | 665,727 | ||||||||||||||||
| Long-Term Cash Bonus(5) | — | 606,668 | 606,668 | 606,668 | 610,000 | 610,000 | ||||||||||||||||
| Executive Group Life Insurance | — | — | 3,165,000 | — | — | — | ||||||||||||||||
47
| Name | Involuntary Termination | Voluntary | Death | Disability | Change in Control without Termination | Change in Control with Termination | ||||||||||||||||||||
| Frederick J. Morganthall II | ||||||||||||||||||||||||||
| Accrued and Banked Vacation | $ | 77,310 | $ | 77,310 | $ | 77,310 | $ | 77,310 | $ | 77,310 | $ | 77,310 | ||||||||||||||
| Severance | — | — | — | — | — | 2,180,016 | ||||||||||||||||||||
| Additional Vacation and Bonus | — | — | — | — | — | 41,443 | ||||||||||||||||||||
| Continued Health and Welfare Benefits(1) | — | — | — | — | — | 27,484 | ||||||||||||||||||||
| Stock Options(2) | — | — | 19,180 | 19,180 | 19,180 | 19,180 | ||||||||||||||||||||
| Restricted Stock(3) | — | — | 5,721,797 | 5,721,797 | 5,721,797 | 5,721,797 | ||||||||||||||||||||
| Performance Units(4) | — | 478,038 | 478,038 | 478,038 | 452,195 | 452,195 | ||||||||||||||||||||
| Long-Term Cash Bonus(5) | — | 559,162 | 559,162 | 559,162 | 561,930 | 561,930 | ||||||||||||||||||||
| Executive Group Life Insurance | — | — | 2,295,000 | — | — | — | ||||||||||||||||||||
48
Item 2. Advisory Vote on Executive Compensation
You are being asked to vote, on an advisory basis, to approve the compensation of our NEOs. The Board of Directors recommends that you vote FOR the approval of compensation of our NEOs.
The Dodd-Frank Wall Street Reform and Consumer Protection Act, enacted in July 2010, requires that we give our shareholders the right to approve, on a nonbinding, advisory basis, the compensation of our NEOs as disclosed earlier in this proxy statement in accordance with the SEC’s rules.
As discussed earlier in the Compensation Discussion and Analysis, our compensation philosophy is to attract and retain the best management talent and to motivate these employees to achieve our business and financial goals. Our incentive plans are designed to reward the actions that lead to long-term value creation. To achieve our objectives, we seek to ensure that compensation is competitive and that there is a direct link between pay and performance. To do so, we are guided by the following principles:
| |
| |
| |
|
The vote on this resolution is not intended to address any specific element of compensation. Rather, the vote relates to the compensation of our NEOs as described in this proxy statement. The vote is advisory. This means that the vote is not binding on Kroger. The Compensation Committee of the Board is responsible for establishing executive compensation. In so doing that Compensation Committee will consider, along with all other relevant factors, the results of this vote.
We ask our shareholders to vote on the following resolution:
“RESOLVED, that the compensation paid to the Company’s NEOs, as disclosed pursuant to Item 402 of Regulation S-K, including the Compensation Discussion and Analysis, compensation tables, and the related narrative discussion, is hereby APPROVED.”
The next advisory vote will occur at our 2017 annual meeting.
The Board of Directors Recommends a VoteFor This Proposal.
49
Director Compensation
2015 Director Compensation
The following table describes the 2015 compensation for non-employee directors. Mr. McMullen does not receive compensation for his Board service.
| Name | Fees Earned or Paid in Cash | Stock Awards(1) | Option Awards(1) | Change in Pension Value and Nonqualified Deferred Compensation Earnings(2) | Total | |||||||||||||||
| Nora A. Aufreiter | $ | 84,772 | $ | 165,586 | — | — | $ | 250,358 | ||||||||||||
| Robert D. Beyer | $ | 124,664 | $ | 165,586 | — | $ | 8,271 | $ | 298,521 | |||||||||||
| Anne Gates(3) | $ | 13,280 | $ | 98,136 | — | — | $ | 111,416 | ||||||||||||
| Susan J. Kropf | $ | 94,745 | $ | 165,586 | — | — | $ | 260,331 | ||||||||||||
| David B. Lewis | $ | 84,772 | $ | 165,586 | — | — | $ | 250,358 | ||||||||||||
| Jorge P. Montoya | $ | 99,731 | $ | 165,586 | — | — | $ | 265,317 | ||||||||||||
| Clyde R. Moore | $ | 104,718 | $ | 165,586 | — | $ | 11,753 | $ | 282,057 | |||||||||||
| Susan M. Phillips | $ | 94,745 | $ | 165,586 | — | $ | 2,701 | $ | 263,032 | |||||||||||
| James A. Runde | $ | 99,731 | $ | 165,586 | — | — | $ | 265,317 | ||||||||||||
| Ronald L. Sargent | $ | 114,691 | $ | 165,586 | — | $ | 2,777 | $ | 283,054 | |||||||||||
| Bobby S. Shackouls | $ | 94,745 | $ | 165,586 | — | — | $ | 260,331 | ||||||||||||
Name
| Fees
| Stock
| Option
| Change in Pension And Nonqualified
| Total
| ||||||||||||||||||||
Nora A. Aufreiter
| $
| 86,371
|
| $
| 165,872
|
| —
|
| —
|
| $
| 252,243
|
| ||||||||||||
Robert D. Beyer
| $
| 127,016
|
| $
| 165,872
|
| —
|
| $10,185
|
| $
| 303,073
|
| ||||||||||||
Anne Gates
| $
| 96,532
|
| $
| 165,872
|
| —
|
| —
|
| $
| 262,404
|
| ||||||||||||
Susan J. Kropf
| $
| 88,062
|
| $
| 165,872
|
| —
|
| —
|
| $
| 253,934
|
| ||||||||||||
Jorge P. Montoya
| $
| 101,613
|
| $
| 165,872
|
| —
|
| —
|
| $
| 267,485
|
| ||||||||||||
Clyde R. Moore
| $
| 106,694
|
| $
| 165,872
|
| —
|
| $149,496
|
| $
| 422,062
|
| ||||||||||||
Susan M. Phillips(4)
| $
| 40,351
|
| $
| —
|
| —
|
| $3,277
|
| $
| 43,628
|
| ||||||||||||
James A. Runde
| $
| 101,613
|
| $
| 165,872
|
| —
|
| —
|
| $
| 267,485
|
| ||||||||||||
Ronald L. Sargent
| $
| 116,855
|
| $
| 165,872
|
| —
|
| $3,360
|
| $
| 286,087
|
| ||||||||||||
Bobby S. Shackouls
| $
| 96,532
|
| $
| 165,872
|
| —
|
| —
|
| $
| 262,404
|
| ||||||||||||
Mark S. Sutton
| $
| 93,678
|
| $
| 165,872
|
| —
|
| —
|
| $
| 259,550
|
| ||||||||||||
| (1) | Amounts reported in the Stock Awards column represent the aggregate grant date fair value of the annual incentive share award, computed in accordance with FASB ASC Topic 718. On July 12, 2017, eachnon-employee director then serving received 7,237 incentive shares with a grant date fair value of $165,872. |
| (2) | Options are no longer granted tonon-employee directors. The aggregate number of previously granted stock options that remained unexercised and outstanding at fiscalyear-end for directors then serving was as follows: Mr. Shackouls held 7,800 options and Messrs. Beyer, Montoya, Moore, Runde and Sargent and Ms. Kropf each held 65,000 options. |
| (3) | The amounts reported for |
50
Annual Compensation
Eachnon-employee director receives an annual cash retainer of $85,000. The chairsChairs of each of the Audit Committee and the Compensation Committee receive an additional annual cash retainer of $20,000. The chairChair of each of the other committees receives an additional annual cash retainer of $15,000. Each member of the Audit Committee receives an additional annual cash retainer of $10,000.
18
The director designated as the Lead Director receives an additional annual cash retainer of $25,000.
Approximately $165,000 worth of Eachnon-employee director also receives incentive shares (Kroger common shares) are issued to non-employee directors aswith a portionvalue of the directors’ overall compensation. On July 15, 2015, each non-employee director, except for Ms. Gates, received 4,320 common shares. Ms. Gates received 2,386 common shares on December 10, 2015 upon joining the Board.approximately $165,000.
The Board has determined that compensation ofnon-employee directors must be competitive on an ongoing basis to attract and retain directors who meet the qualifications for service on the Board.Non-employee director compensation will be reviewed from time to time as the Corporate Governance Committee deems appropriate.
Pension Plan
Non-employee directors first elected prior to July 17, 1997 receive an unfunded retirement benefit equal to the average cash compensation for the five calendar years preceding retirement. Only Mr. Moore is eligible for this benefit. Participants who retire from the Board prior to age 70 will be credited with 50% vesting after five years of service, and 10% for each additional year up to a maximum of 100%. Benefits for participants who retire prior to age 70 begin at the later of actual retirement or age 65.
Nonqualified Deferred Compensation
We also maintain a deferred compensation plan fornon-employee directors. Participants may defer up to 100% of their cash compensation and/or the receipt of all (and not less than all) of the annual award of incentive shares.
Cash Deferrals
Cash deferrals are credited to a participant’s deferred compensation account. Participants may elect from either or both of the following two alternative methods of determining benefits:
| |
|
In both cases, deferred amounts are paid out only in cash, based on deferral options selected by the participant at the time the deferral elections are made. Participants can elect to have distributions made in a lump sum or in quarterly installments, and may make comparable elections for designated beneficiaries who receive benefits in the event that deferred compensation is not completely paid out upon the death of the participant.
Incentive Share Deferrals
Participants may also defer the receipt of all (and not less than all) of the annual award of incentive shares. Distributions will be made by delivery of Kroger common shares within 30 days after the date which is 6 months after the participant’s separation of service.
51
19
Beneficial Ownership of Common Stock
The following table sets forth the common shares beneficially owned as of April 1, 20162018 by Kroger’s directors, the NEOs, and the directors and executive officers as a group. The percentage of ownership is based on 964,367,417854,098,314 of Kroger common shares outstanding on April 1, 2016.2018. Shares reported as beneficially owned include shares held indirectly through Kroger’s defined contribution plans and other shares held indirectly, as well as shares subject to stock options exercisable on or before May 31, 2016.2018. Except as otherwise noted, each beneficial owner listed in the table has sole voting and investment power with regard to the common shares beneficially owned by such owner.
| Name | Amount and Nature of Beneficial Ownership(1) (a) | Options | ||||||
| Nora A. Aufreiter(2) | 7,513 | — | ||||||
| Robert D. Beyer(2) | 295,682 | 77,200 | ||||||
| Michael J. Donnelly | 467,879 | 249,296 | ||||||
| Anne Gates | 2,386 | — | ||||||
| Christopher T. Hjelm | 379,250 | 141,152 | ||||||
| Susan J. Kropf | 137,460 | 67,200 | ||||||
| David B. Lewis(2) | 158,255 | 67,200 | ||||||
| W. Rodney McMullen | 3,292,520 | 1,041,184 | ||||||
| Jorge P. Montoya(3) | 101,362 | 67,200 | ||||||
| Clyde R. Moore | 145,860 | 57,200 | ||||||
| Frederick J. Morganthall II | 183,101 | — | ||||||
| Susan M. Phillips | 176,923 | 67,200 | ||||||
| James A. Runde | 154,460 | 77,200 | ||||||
| Ronald L. Sargent(2) | 152,630 | 77,200 | ||||||
| J. Michael Schlotman | 606,675 | 248,304 | ||||||
| Bobby S. Shackouls(2)(4) | 73,180 | — | ||||||
| Directors and executive officers as a group (29 persons, | ||||||||
| including those named above) | 8,187,350 | 2,998,844 | ||||||
Name
| Amount and Nature
| Options Exercisable
| ||||||||
Stuart W. Aitken(2)
|
| 105,293
|
|
| 15,895
|
| ||||
Nora A. Aufreiter(3)
|
| 19,442
|
|
| —
|
| ||||
Robert D. Beyer(3)
|
| 315,361
|
|
| 65,000
|
| ||||
Michael J. Donnelly
|
| 563,728
|
|
| 282,692
|
| ||||
Anne Gates
|
| 14,145
|
|
| —
|
| ||||
Christopher T. Hjelm
|
| 506,918
|
|
| 260,536
|
| ||||
Susan J. Kropf
|
| 146,910
|
|
| 65,000
|
| ||||
W. Rodney McMullen
|
| 3,854,390
|
|
| 1,279,448
|
| ||||
Jorge P. Montoya(4)
|
| 107,316
|
|
| 65,000
|
| ||||
Clyde R. Moore
|
| 165,310
|
|
| 65,000
|
| ||||
James A. Runde
|
| 163,910
|
|
| 65,000
|
| ||||
Ronald L. Sargent(3)
|
| 165,232
|
|
| 65,000
|
| ||||
J. Michael Schlotman
|
| 736,329
|
|
| 456,203
|
| ||||
Bobby S. Shackouls(3)
|
| 81,102
|
|
| 7,800
|
| ||||
Mark S. Sutton
|
| 9,691
|
|
| —
|
| ||||
| Directors and executive officers as a group (28 persons, including those named above) |
| 9,162,150
|
|
| 3,649,733
|
| ||||
| (1) | No director or officer owned as much as 1% of Kroger common shares. The directors and executive officers as a group beneficially owned less than 1% of Kroger common shares. | |
| (2) | This amount includes 3,018 shares held by Mr. Aitken’s wife. He disclaims beneficial ownership of these shares. |
| (3) | This amount includes incentive share awards that were deferred under the deferred compensation plan for independent directors in the following amounts: Ms. Aufreiter, |
| (4) | This amount includes 22,000 shares held in Mr. Montoya’s trust. | |
52
20
The following table sets forth information regarding the beneficial owners of more than five percent of Kroger common shares as of April 1, 20162018 based on reports on Schedule 13G filed with the SEC.
| Name | Address of Beneficial Owner | Amount and Nature of Ownership | Percentage of Class | |||
| BlackRock, Inc.(1) | 55 East 52ndStreet | 66,134,371 | 6.80% | |||
| New York, NY 10055 | ||||||
| Vanguard Group Inc.(2) | 100 Vanguard Blvd | 54,699,370 | 5.61% | |||
| Malvern, PA 19355 |
Name | Address | Amount and Nature of Ownership | Percentage of Class | |||||||||
BlackRock, Inc. | 55 East 52ndSt. New York, NY 10055 | 64,312,967 | (1) | 7.53 | % | |||||||
Vanguard Group Inc. | 100 Vanguard Blvd. Malvern, PA 19355 | 69,066,614 | (2) | 8.09 | % | |||||||
| (1) | Reflects beneficial ownership by BlackRock Inc., as of December 31, | |
| (2) | Reflects beneficial ownership by Vanguard Group Inc. as of December 31, |
Section 16(a) Beneficial Ownership Reporting Compliance
Section 16(a) of the Securities Exchange Act of 1934 requires our officers and directors, and certain persons who own more than 10% of a registered class of our equity securities,outstanding common shares, to file reports of ownership and changes in ownership with the SEC. Those officers, directorsSEC and shareholders are required by SEC regulation to furnish us with copies of all Section 16(a) forms they file.those reports.
Based solely on our review of the copies of Forms 3, 4 and 45 received by Kroger, and any written representations from certain reporting persons that no FormsForm 5 werewas required for those persons,that person, we believe that during 20152017 all filing requirements applicable to our executive officers, directors and 10% beneficial owners were timely satisfied, with the following exception. In August 2015, Michael L. Ellis, who retired as President and Chief Operating Officer of the Company in July 2015, was 2 days late in the filing of a Form 4 to report a stock purchase in the amount of 500 shares.satisfied.
Related Person Transactions
The Board has adopted a written policy requiring that any Related Person Transaction may be consummated or continue only if the Audit Committee approves or ratifies the transaction in accordance with the policy. A “Related Person Transaction” is one (a) involving Kroger, (b) in which one of our directors, nominees for director, executive officers, or greater than five percent shareholders, or their immediate family members, have a direct or indirect material interest; and (c) the amount involved exceeds $120,000 in a fiscal year.
The Audit Committee will approve only those Related Person Transactions that are in, or not inconsistent with, the best interests of Kroger and its shareholders, as determined by the Audit Committee in good faith in accordance with its business judgment. No director may participate in any review, approval or ratification of any transaction if he or she, or an immediate family member, has a direct or indirect material interest in the transaction.
Where a Related Person Transaction will be ongoing, the Audit Committee may establish guidelines for management to follow in its ongoing dealings with the related person and the Audit Committee will review and assess the relationship on an annual basis to ensure it complies with such guidelines and that the Related Person Transaction remains appropriate.
21
Compensation Discussion and Analysis
Executive Summary
Named Executive Officers
This Compensation Discussion and Analysis provides a discussion and analysis of our compensation program for our named executive officers (“NEOs”). For the 2017 fiscal year ended February 3, 2018, the NEOs were:
Name | Title | |
W. Rodney McMullen | Chairman and Chief Executive Officer | |
J. Michael Schlotman | Executive Vice President and Chief Financial Officer | |
Michael J. Donnelly | Executive Vice President and Chief Operating Officer | |
Christopher T. Hjelm | Executive Vice President and Chief Information Officer | |
Stuart W. Aitken | Group Vice President |
Summary of Key Compensation Practices
| What we do: | What we do not do: | |
✓ Align pay and performance ✓ Significant share ownership guidelines of 5x salary for our CEO ✓ Multiple performance metrics under our short- and long-term performance-based plans discourage excessive risk taking ✓ Balance between short-term and long-term compensation to discourage short-term risk taking at the expense of long-term results ✓ Engagement of an independent compensation consultant ✓ Robust clawback policy ✓ Ban on hedging, pledging and short sales of Kroger securities ✓ Limited perquisites | × No employment contracts with executives × No special severance or change of control programs applicable only to executive officers × No taxgross-up payments for executives × Nore-pricing or backdating of options × No guaranteed salary increases or bonuses × No payment of dividends or dividend equivalents until performance units are earned × No single-trigger cash severance benefits upon a change in control |
22
Summary of Fixed and53At-Risk Pay Elements
The fixed andat-risk pay elements of NEO compensation are reflected in the following table and charts.
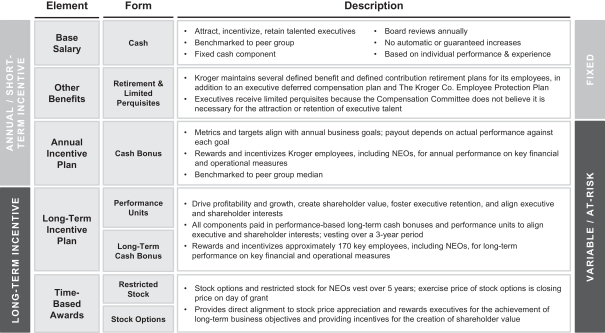
The amounts used in the charts below are based on the amounts reported in the Summary Compensation Table for 2017, excluding the Change in Pension Value and Nonqualified Deferred Compensation Earnings column.
CEO
84% of CEO pay is At Risk | CEO
83% of CEO pay is Long-Term | CEO
80% of CEO pay is Equity |
Average of Other NEOs
73% of Other NEO pay is At Risk | Average of Other NEOs
72% of Other NEO pay is | Average of Other NEOs
68% of Other NEO pay is Equity |
23
ANNUAL/SHORT- TERM INCENTIVE LONG-TERM INCENTIVE FIXED VARIABLE /AT-RISK
Base Salary Other Benefits Annual Incentive Plan Long-Term Incentive Plan Time-Based Awards Cash Retirement& Limited Perquisites Cash Bonus Performance Units Long-Term Cash Bonus Restricted Stock Stock Options Attract, incentivize, retain talented executives Board reviews annually Benchmarked to peer group No automatic or guaranteed increases Fixed cash component Based on individual performance & experience Kroger maintains several defined benefit and defined contribution retirement plans for its employees, in addition to an executive deferred compensation plan and The Kroger Co. Employee Protection Plan Executives receive limited perquisites because the Compensation Committee does not believe it is necessary for the attraction or retention of executive talent Metrics and targets align with annual business goals; payout depends on actual performance against each goal Rewards and incentivizes Kroger employees, including NEOs, for annual performance on key financial and operational measures Benchmarked to peer group median Drive profitability and growth, create shareholder value, foster executive retention, and align executive and shareholder interests All components paid in performance-based long-term cash bonuses and performance units to align executive and shareholder interests: vesting over a3-year period Rewards and incentivizes approximately 170 key employees, including NEOs, for long-term performance on key financial and operational measures Stock options and restricted stock for NEOs vest over 5 years: exercise price of stock options is closing price on day of grant Provides direct alignment to stock price appreciation and rewards executives for the achievement of long-term business objectives and providing incentives for the creation of shareholder value
Looking Ahead – Realignment of Performance-Based Pay to Restock Kroger for 2018 and Beyond
Restock Kroger
In October 2017, we announcedRestock Kroger,our plan to redefine the food and grocery customer experience in America and to create value for our shareholders. We developed the plan because, though we are proud of our long history of success and our strengths, we recognize that what got us here will not get us where we want to be in the future.Restock Krogerhas four main drivers:
| 1. | Redefine the Food and Grocery Customer Experience: Focus on data and personalization, digital, space optimization, Our Brands, and smart pricing |
| 2. | Expand Partnerships to Create Customer Value: Focus on front end transformation, technology innovation, cost reduction and alternative revenue streams |
| 3. | Develop Talent: Accelerate high-performance leadership culture through future talent development, training, and a rebalancing of pay and benefits |
| 4. | Live Kroger’s Purpose: Meet Zero Hunger | Zero Waste targets and achieve 2020 sustainability goals |
The three-yearRestock Krogerplan is fueled by capital investments, cost savings and free cash flow. As a result of our plan, over the next three years (2018 – 2020), we expect to generate:
We have prioritized our estimated $9 billion in capital investments to supportRestock Kroger over the next three years. We are looking first for sales-driving and cost-savings opportunities across bothbrick-and-mortar and digital platforms; followed by investments in logistics and technology platforms; and finally capital for storing activity.*
Our Compensation Committee is Focused on Pay for Performance
The Compensation Committee has long maintained a strong pay for performance philosophy. Compensation must align the interests of our NEOs with the interests of our shareholders and must create incentives to achieve the annual business plan targets and longer term company objectives.
We implemented a long-term performance based bonus program for NEOs more than ten years ago, and the metrics were tailored to our long-term measures at that time. As our business objectives have shifted, the Compensation Committee is focused on ensuring performance metrics are aligned with our long-term strategy.
Our Long-Term Compensation Program: Align with Restock Kroger
We have made new commitments to shareholders on a three-year time horizon underRestock Kroger.We believe that the success ofRestock Kroger depends on the focused attention of our leadership team and associates on the goals ofRestock Kroger and that it is essential to implement new performance metrics that mirror these new commitments. We are describing our approach for developing our 2018 LTIP program, even though it is still a work in progress, to be transparent about how we are planning to make changes to our program to align withRestock Kroger.
Our 2018 three-year long-term plan (2018 – 2020) will have performance metrics tied toRestock Kroger goals:free cash flow and cost savings included in FIFO operating profit growth, with a return on
| * | For important risk, uncertainties and other factors relating to these forward-looking statements, see the Risk Factors in our Annual Report on Form 10-K that accompanies this proxy statement. |
24
invested capital modifier. We are implementing a metric based on the cost savings imbedded in the achievement of operating profit growth, because cost savings is essential to fund the strategic projects that will produce the operating profit growth. We believe it is a more meaningful metric than operating profit growth itself, because it forces us to focus on the savings that we need to support sustainable incremental operating profit growth.
Since we grant a new three-year long-term incentive plan each year, at any one time, there are three outstanding plans. As we aremid-cycle in the 2016 – 2018 and 2017 – 2019 long-term plans, we feel strongly that we should focus onRestock Kroger metrics rather than having competing priorities. As a result, the Compensation Committee has determined that the metrics of themid-cycle plans should be modified to align withRestock Kroger.
For the outstanding 2016 – 2018 long-term plan, fiscal year 2016 and 2017 performance will be measured on the existing plan metrics and will be applied totwo-thirds of the previously granted cash and performance unit bonus target amounts. Fiscal year 2018 performance will be measured on theRestock Krogermetrics of free cash flow and savings included in FIFO operating profit growth, and will be applied toone-third of the previously granted cash and performance unit bonus target amounts.
Similarly, for the outstanding 2017 – 2019 long-term plan, fiscal year 2017 performance will be measured on the existing plan metrics and will be applied toone-third of the previously granted cash and performance unit bonus target amounts. Fiscal year 2018 and 2019 performance will be measured on the Restock Krogermetrics of free cash flow and cost savings included in FIFO operating profit growth, and will be applied totwo-thirds of the previously granted cash and performance unit bonus target amounts.
We are not adjusting cash bonus potentials orre-issuing previously issued performance unit grants and we are not allowing NEOs tore-earn cash and performance units that were not earned in the completed year(s) of the outstanding plans. We did not change the timing of the payout under the outstanding plans. These plan updates are illustrated below.
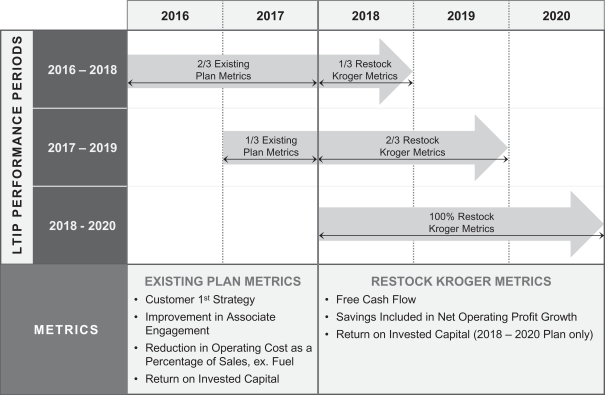
25
Our Annual Cash Bonus Program: Based on Meeting Financial Goals
We have also redesigned the performance-based annual cash bonus plan to better align with our financial goals ofRestock Krogerand to simplify the way we reward our associates. The 2018 annual plan has the following metrics:
| 1. | ID sales |
| 2. | Earnings per share |
| 3. | Strategic business plans that supportRestock Kroger |
To further support the cost saving focus ofRestock Kroger,for any payout under the strategic business plans metric, the Company must have met its cost savings goals for 2018.
Our Compensation Philosophy and Objectives
As one of the largest retailers in the world, our executive compensation philosophy is to attract and retain the best management talent as well as motivate these employees to achieve our business and financial goals. Kroger’s incentive plans are designed to reward the actions that lead to long-term value creation. The Compensation Committee believes that there is a strong link between our business strategy, the performance metrics in our short-term and long-term incentive programs, and the business results that drive shareholder value.
We believe our strategy creates value for shareholders in a manner consistent with our core values: honesty, integrity, respect, inclusion, diversity and safety.
To achieve our objectives, the Compensation Committee seeks to ensure that compensation is competitive and that there is a direct link between pay and performance. To do so, it is guided by the following principles:
The Compensation Committee has three related objectives regarding compensation:
Components of Executive Compensation at Kroger
Compensation for our NEOs is comprised of the following:
| ○ | Salary |
| ○ | Performance-Based Annual Cash Bonus |
26
| ○ | Performance-Based Long-Term Incentive Plan (consisting of a long-term cash bonus and performance units) |
| ○ | Non-qualified stock options |
| ○ | Restricted stock |
The annual and long-term performance-based compensation awards described herein were made pursuant to our 2014 Long-Term Incentive and Cash Bonus Plan, which was approved by our shareholders in 2014.
Annual Compensation – Salary
Our philosophy with respect to salary is to provide a sufficient and stable source of fixed cash compensation. All of our compensation cannot beat-risk or long-term. It is important to provide a meaningful annual salary to attract and retain a high caliber leadership team, and to have an appropriate level of cash compensation that is not variable.
Salaries for the NEOs (with the exception of the CEO) are established each year by the Compensation Committee, in consultation with the CEO. The CEO’s salary is established by all of the independent directors. Salaries for the NEOs are reviewed annually in June.
The amount of each NEO’s salary is influenced by numerous factors including:
The assessment of individual contribution is a qualitative determination, based on the following factors:
Annual Compensation – Performance-Based Annual Cash Bonus
The NEOs participate in a performance-based annual cash bonus plan. The amount of annual cash bonus that the NEOs earn each year is based upon Kroger’s performance compared to goals established by the Compensation Committee and the independent directors based on the business plan adopted by the Board of Directors. A minimum level of performance must be achieved before any payouts are earned, while a payout of up to 200% of target bonus potential can be achieved for
27
superior performance. There are no guaranteed or minimum payouts; if none of the performance goals are achieved, then none of the bonus is earned and no payout is made.
The annual cash bonus plan is designed to encourage decisions and behavior that drive the annual operating results and the long-term success of the Company. Kroger’s success is based on a combination of factors, and accordingly the Compensation Committee believes that it is important to encourage behavior that supports multiple elements of our business strategy.
Establishing Annual Cash Bonus Potentials
The Compensation Committee establishes annual cash bonus potentials for each NEO, other than the CEO, whose annual cash bonus potential is established by the independent directors. Actual payouts represent the extent to which performance meets or exceeds the goals established by the Compensation Committee. Actual payouts may be as low as zero if performance does not meet the goals established by the Compensation Committee or as high as 200% of the potential bonus amount if the performance far exceeds thesepre-established goals.
The Compensation Committee considers multiple factors in making its determination or recommendation as to annual cash bonus potentials:
28
2017 Annual Cash Bonus Plan Metrics
The 2017 annual cash bonus plan had the following measurable performance metrics, all of which are interconnected:
Metric | Weight | Rationale for Use | ||
ID Sales | 20% | • ID Sales represent sales, without fuel, at our supermarkets that have been open without expansion or relocation for five full quarters. • We believe this is the best measure of the real growth of our sales across the enterprise. A key driver of our model is strong ID Sales; it is the engine that fuels our growth. | ||
Net Operating Profit, without Supermarket Fuel Operating Profit (“Net Operating Profit”)(1) | 20% | • Net Operating Profit allows us to evaluate our earnings from operating the business; we cannot achieve solid Net Operating Profit without a strong operating model. • This is a good measure of the profitability of the business which takes into account the capital invested to generate the earnings. | ||
Customer 1st Strategy | 60% | • Kroger’s Customer 1stStrategy is the focus, in our decision-making, on the customer. The “Four Keys” of our Customer 1stStrategy are People, Products, Shopping Experience and Price. • This proprietary metric includes a mixture of strategic and operational metrics that measure the improvement in how Kroger is perceived by customers in each of the Four Keys. • Annual cash bonus payout is based on certain elements of the Customer 1stStrategy, to highlight annual objectives that are intended to receive the most focused attention in that year. | ||
Total of 3 Metrics | 100% | |||
ClickList Bonus | 5% “Kicker” | • An additional 5% is earned if Kroger achieves certain goals with respect to our ClickList expansion and operations. • The ClickList bonus is included in the annual cash bonus plan as an incentive to encourage the addition of ClickList locations at a faster rate, while maintaining certain operating and financial standards. • The ClickList bonus of 5% is only available if thepre-determined measures are met. If any of the goals are not met, no portion of the ClickList bonus is earned. | ||
| (1) | Net Operating Profit is calculated as gross profit, minus operating, general and administrative expenses, minus depreciation and amortization, excluding supermarket fuel and thenon-Kroger portion of earnings of consolidated variable interest entities. |
29
Results of 2017 Annual Cash Bonus Plan
The 2017 goals established by the Compensation Committee, the actual 2017 results and the bonus percentage earned for each of the performance metrics of the 2017 annual cash bonus plan were as follows:
Goals
| Actual Performance Compared to Minimum Goal
| Amount
| ||||||||||||||||||||||||||||
| Performance Metrics | Minimum | Target (100%) | Actual Performance | Weight (B) | ||||||||||||||||||||||||||
ID Sales
|
| 0.90%
|
|
| 2.90%
|
|
| 0.71%
|
|
| 0%
|
|
| 20%
|
|
| 0%
|
| ||||||||||||
Net Operating Profit
|
| $2.93 Billion
|
|
| $3.45 Billion
|
|
| $2.85 Billion
|
|
| 0%
|
|
| 20%
|
|
| 0%
|
| ||||||||||||
Customer 1stStrategy(1)
|
| *
|
|
| *
|
|
| *
|
|
| *
|
|
| 60%
|
|
| 3.8%
|
| ||||||||||||
ClickList Bonus(2)
|
| *
|
|
| *
|
|
| *
|
|
| *
|
|
| 0% or 5%
|
|
| 0%
|
| ||||||||||||
Total Earned
|
| 3.8%
|
| |||||||||||||||||||||||||||
| (1) | The Customer 1stStrategy goal also was established by the Compensation Committee at the beginning of the year, but is not disclosed as it is competitively sensitive. |
| (2) | An additional 5% would have been earned if Kroger had achieved certain goals with respect to its ClickList expansion and operation. These goals were established by the Compensation Committee at the beginning of the year, but are not disclosed as they are competitively sensitive. |
Following the close of the year, the Compensation Committee reviewed Kroger’s performance against each of the metrics outlined above and determined the extent to which Kroger achieved those objectives. Due to our performance when compared to the goals established by the Compensation Committee, the NEOs earned 3.8% of their bonus potentials.
In 2017, as in all years, the Compensation Committee retained discretion to reduce the annual cash bonus payout for all executive officers, including the NEOs, if the Compensation Committee determined for any reason that the bonus payouts were not appropriate given their assessment of Company performance – however, no adjustments were made in 2017 that affected NEO bonuses. The independent directors retained that discretion for the CEO’s bonus. The Compensation Committee and the independent directors also retained discretion to adjust the goals for each metric under the plan should unanticipated developments arise during the year.
30
The actual annual cash bonus percentage payout for 2017 represented performance that did not meet many of our business plan objectives. The strong link between pay and performance is illustrated by a comparison of earned amounts under our annual cash bonus plan in previous years, such as 2011, 2014 and 2015, when payouts significantly exceeded 100%. In those years, we achieved and/or exceeded many of our business plan objectives.A comparison of actual annual cash bonus percentage payouts this year and in prior years demonstrates the variability of annual cash bonus incentive compensation and its strong link to our performance:
Fiscal Year
| Annual Cash Bonus Payout Percentage
| |||||
2017 | 3.8% | |||||
2016 | 19.9% | |||||
2015 | 126.7% | |||||
2014 | 121.5% | |||||
2013 | 104.9% | |||||
2012 | 85.9% | |||||
2011 | 138.7% | |||||
2010 | 53.9% | |||||
2009 | 38.5% | |||||
2008 | 104.9% | |||||
As described above, the annual cash bonus payout percentage is applied to each NEO’s bonus potential, which is determined by the Compensation Committee, and the independent directors in the case of the CEO. The actual amounts of performance-based annual cash bonuses paid to the NEOs for 2017 are reported in the Summary Compensation Table in the“Non-Equity Incentive Plan Compensation” column and footnote 4 to that table.
Long-Term Compensation
The Compensation Committee believes in the importance of providing an incentive to the NEOs to achieve the long-term goals established by the Board. As such, a majority of compensation is conditioned on the achievement of the Company’s long-term goals and is delivered via four long-term compensation vehicles: long-term cash bonus, performance units, stock options and restricted stock. Long-term compensation promotes long-term value creation and discourages the over-emphasis of attaining short-term goals at the expense of long-term growth.
The Compensation Committee considers several factors in determining the target value of long-term compensation awarded to the NEOs or, in the case of the CEO, recommending to the independent directors the amount awarded. These factors include:
Long-term incentives are structured to be a combination of performance- and time-based compensation that reflects elements of financial and common shares performance to provide both retention value and alignment with company performance. Long-term cash bonus and performance unit payouts are contingent on the achievement of certain strategic performance and financial measures and incentivize recipients to promote long-term value creation and enhance shareholder wealth by supporting the Company’s long-term strategic goals. Stock options and restricted stock are linked to common shares performance creating alignment between the NEOs and our shareholders’
31
interests. Options have no initial value and recipients only realize benefits if the value of our common shares increases following the date of grant.
A majority of long-term compensation is equity-based (performance units, stock options, and restricted stock) and is tied to the future value of our common shares, further aligning the interests of our NEOs with our shareholders. All four components of long-term compensation are intended to focus executive behaviors on our long-term strategy. Each component is described in more detail below.
Amounts of long-term compensation awards issued and outstanding for the NEOs are set forth in the Executive Compensation Tables section.
Long-Term Incentive Plan Design
In recent years, we have adopted a similar Long-Term Incentive Plan each year, which provides for overlapping three-year performance periods. The Long-Term Incentive Plans adopted in 2015, 2016 and 2017, which consist of a performance-based long-term cash bonus and performance units, have the following characteristics:
The Compensation Committee anticipates adopting a new Long-Term Incentive Plan each year, measuring improvement over successive three-year periods. Each year when establishing the performance metric baselines and percentage payouts per unit of improvement, the Compensation Committee considers the difficulty of achieving compounded improvement over time.
32
Long-Term Incentive Plan Metrics
The following table summarizes the Long-Term Incentive Plans adopted in 2015, 2016 and 2017:
| Metric | Rationale for Use | |
Customer 1stStrategy | • Kroger’s Customer 1stStrategy is the focus, in our decision-making, on the customer. The Four Keys of our Customer 1stStrategy are People, Products, Shopping Experience and Price. • This proprietary metric measures the improvement in how Kroger is perceived by customers in each of the Four Keys. • Long-Term Incentive Plan payout is based on all of the elements of the Customer 1stStrategy, to maintain our top executives’ consistent focus on the entirety of the Customer 1stStrategy. This is in contrast to the 2017 annual cash bonus payout, which is based on certain elements of the Customer 1stStrategy, to highlight annual objectives that are intended to receive the most focused attention in that year. | |
Improvement in Associate | • Kroger measures associate engagement in an annual survey of associates. • This metric is included in these Long-Term Incentive Plans as an acknowledgement that our Company’s success is directly tied to our associates connecting with and serving our customers every day, whether in our stores, manufacturing plants, distribution centers or offices. | |
Reduction in Operating | • An essential part of Kroger’s model is to increase productivity and efficiency, and to take costs out of the business in a sustainable way. • We strive to be disciplined, so that as the Company grows, expenses are properly managed. Including this metric in these Long-term Incentive Plans, provides an incentive to implement policies for sustainable improvement over a long period of time. | |
ROIC(2) | • Part of our long-term growth strategy is to make substantial capital investments over time. We have a pipeline of high quality projects. • With significant capital spend, it is essential that we achieve the proper returns on our investments. • This measure is intended to hold executives accountable for the returns on the capital investments. |
| (1) | Operating Costs is anon-GAAP measure and is calculated as the sum of (i) operating, general and administrative expenses, depreciation and amortization, and rent expense, without fuel, and (ii) warehouse and transportation costs, shrink, and advertising expenses, for our supermarket operations, without fuel. Operating costs will excludeone-time expenses incurred in lieu of future anticipated obligations. Future expenses that are avoided by virtue of the incurrence of theone-time expense will be deemed to be total operating costs in the year in which they otherwise would have been incurred. |
| (2) | Return on invested capital is anon-GAAP measure and is calculated by dividing adjusted operating profit for the prior four quarters by the average invested capital. Adjusted operating profit is calculated by excluding certain items included in operating profit, and adding ourlast-in, first out |
33
| (“LIFO”) charge, depreciation and amortization, and rent. Average invested capital will be calculated as the sum of (i) the average of our total assets, (ii) the average LIFO reserve, (iii) the average accumulated depreciation and amortization, and (iv) a rent factor equal to total rent for the last four quarters multiplied by a factor of eight; minus (i) the average taxes receivable, (ii) the average trade accounts payable, (iii) the average accrued salaries and wages, and (iv) the average other current liabilities, excluding accrued income taxes. |
The following table summarizes the Long-Term Incentive Plans for the years shown, as adopted:
2015 Plan | 2016 Plan | 2017 Plan | ||||
Performance Period | 2015 to 2017 | 2016 to 2018 | 2017 to 2019 | |||
Payout Date | March 2018 | March 2019 | March 2020 | |||
Long-term Cash | Salary at end of fiscal year 2014* | Salary at end of fiscal year 2015* | Salary at end of fiscal year 2016* | |||
Performance Metrics | ||||||
Customer 1stStrategy | 4% payout per unit improvement | 4% payout per unit improvement | 4% payout per unit improvement | |||
Improvement in Associate Engagement | 4% payout per unit improvement | 4% payout per unit improvement | 4% payout per unit improvement | |||
Reduction in Operating Cost as a Percentage of Sales, | 0.50% payout per 0.01% reduction in operating costs Baseline: 26.41% | 0.50% payout per 0.01% reduction in operating costs Baseline: 26.16% | 0.50% payout per 0.01% reduction in operating costs Baseline: 26.23% | |||
ROIC | 1% payout per 0.01% improvement in ROIC Baseline: 13.50% | 1% payout per 0.01% improvement in ROIC Baseline: 13.73% | 4% payout per 0.01% improvement in ROIC Baseline: 13.23% | |||
| * | Or date of plan entry, if later. |
As described above, under “Looking Ahead – Realignment of Performance-Based Pay to Restock Kroger for 2018 and Beyond” the metrics listed above for the 2016 and 2017 plans will be used to measure performance through 2017 and will be applied to the previously granted cash and performance unit bonus targets on a prorated basis. Performance for 2018 and 2019 will be measured on theRestock Krogermetrics of free cash flow and cost savings included in FIFO operating profit growth and will also be applied to bonus targets on a prorated basis.
34
Results of 2015 Long-Term Incentive Plan
The 2015 Long-Term Incentive Plan, which measured improvements over the three year period from 2015 to 2017, paid out in March 2018 and was calculated as follows:
Metric
| Baseline
| Result
| Improvement (A)
| Payout per
| Percentage
| |||||||||
Customer 1stStrategy(1)
|
| *
|
|
| *
|
| 6 units of improvement
| 4.0%
| 24.0%
| |||||
Improvement in Associate Engagement(1)
|
| *
|
|
| *
|
| no improvement
| 4.0%
| 0.0%
| |||||
Reduction in Operating Cost as a Percentage of Sales, without Fuel |
| 26.41%
|
|
| 26.77%
|
| no improvement
| 0.5%
| 0.0%
| |||||
Return on Invested Capital
|
| 13.50%
|
|
| 12.31%
|
| no improvement
| 1.0%
| 0.0%
| |||||
Total
| 24.0%
| |||||||||||||
| (1) | The Customer 1stStrategy and Improvement in Associate Engagement components were established by the Compensation Committee at the beginning of the performance period, but are not disclosed as they are competitively sensitive. |
Accordingly, each NEO received a long-term cash bonus in an amount equal to 24.0% of that executive’s long-term cash bonus potential, and was issued the number of Kroger common shares equal to 24.0% of the number of performance units awarded to that executive, along with a cash amount equal to the dividends paid on that number of common shares during the three year performance period. The cash payout and dividends paid on common shares earned under the 2015 Long-Term Incentive Plan are reported in the“Non-Equity Incentive Plan Compensation” and “All Other Compensation” columns of the Summary Compensation Table and footnotes 4 and 6 to that table, respectively, and the common shares issued under the plan are reported in the 2017 Option Exercises and Stock Vested Table and footnote 2 to that table.
Stock Options and Restricted Stock
Stock options and restricted stock continue to play an important role in rewarding NEOs for the achievement of long-term business objectives and providing incentives for the creation of shareholder value. Awards based on Kroger’s common shares are granted annually to the NEOs and a large number of other employees. Kroger historically has distributed time-based equity awards widely, aligning the interests of employees with your interest as shareholders.
The options permit the holder to purchase Kroger common shares at an option price equal to the closing price of Kroger common shares on the date of the grant. Options are granted only on one of the four dates of Board meetings conducted after Kroger’s public release of its quarterly earnings results.
The Compensation Committee determines the vesting schedule for stock options and restricted stock. During 2017, the Compensation Committee granted to the NEOs stock options and restricted stock, each with a five-year vesting schedule, with the exception of a specialone-time restricted stock grant awarded to each of Messrs. Donnelly and Aitken, each of which vests 25% on each of the first two anniversaries of the grant date and 50% on the third anniversary of the grant date.
As discussed below under Stock Ownership Guidelines, covered individuals, including the NEOs, must hold 100% of common shares issued pursuant to performance units earned, the shares received upon the exercise of stock options or upon the vesting of restricted stock, except those necessary to pay the exercise price of the options and/or applicable taxes, until applicable stock ownership guidelines are met, unless the disposition is approved in advance by the CEO, or by the Board or Compensation Committee for the CEO.
35
Retirement and Other Benefits
Kroger maintains several defined benefit and defined contribution retirement plans for its employees. The NEOs participate in one or more of these plans, as well as one or more excess plans designed to make up the shortfall in retirement benefits created by limitations under the Internal Revenue Code (the “Code”) on benefits to highly compensated individuals under qualified plans. Additional details regarding certain retirement benefits available to the NEOs can be found below in footnote 6 to the Summary Compensation Table and the 2017 Pension Benefits Table and the accompanying narrative.
Kroger also maintains an executive deferred compensation plan in which some of the NEOs participate. This plan is a nonqualified plan under which participants can elect to defer up to 100% of their cash compensation each year. Additional details regarding our nonqualified deferred compensation plans available to the NEOs can be found below in the 2017 Nonqualified Deferred Compensation Table and the accompanying narrative.
Kroger also maintains The Kroger Co. Employee Protection Plan (“KEPP”), which covers all of our management employees who are classified as exempt under the federal Fair Labor Standards Act and certain administrative or technical support personnel who are not covered by a collective bargaining agreement, with at least one year of service. KEPP provides for severance benefits and extended Kroger-paid health care, as well as the continuation of other benefits as described in the plan, when an employee is actually or constructively terminated without cause within two years following a change in control of Kroger (as defined in KEPP). Participants are entitled to severance pay of up to 24 months’ salary and target annual bonus. The actual amount is dependent upon pay level and years of service. KEPP can be amended or terminated by the Board at any time prior to a change in control.
Performance-based long-term cash bonus, performance unit, stock option, and restricted stock agreements with award recipients provide that those awards “vest,” with 50% of the long-term cash bonus potential being paid, common shares equal to 50% of the performance units being awarded, options becoming immediately exercisable, and restrictions on restricted stock lapsing upon a change in control as described in the grant agreements.
None of the NEOs is party to an employment agreement.
Perquisites
Our NEOs receive limited perquisites because the Compensation Committee does not believe that it is necessary for the attraction or retention of management talent to provide executives a substantial amount of compensation in the form of perquisites. In 2017, all of the NEOs received the following benefits: premiums paid on life insurance policies, premiums paid on accidental death and dismemberment insurance and premiums paid on long-term disability insurance policies. In 2017, Mr. Aitken received reimbursement of tax preparation fees and cell phone fees. Further details on these benefits can be found in footnote 6 to the Summary Compensation Table.
Process for Establishing Executive Compensation
The Compensation Committee of the Board has the primary responsibility for establishing the compensation of our executive officers, including the NEOs, with the exception of the CEO. The Compensation Committee’s role regarding the CEO’s compensation is to make recommendations to the independent members of the Board; those members of the Board establish the CEO’s compensation.
The Compensation Committee directly engaged a compensation consultant from Mercer to advise the Compensation Committee in the design of compensation for executive officers, through the 2017 compensation planning cycle.
36
The Mercer consultant conducted an annual competitive assessment of executive positions at Kroger for the Compensation Committee. The assessment is one of several bases, as described above, on which the Compensation Committee determines compensation. The consultant assessed:
In addition to the factors identified above, the consultant also reviewed actual payout amounts against the targeted amounts.
The consultant compared these elements against those of other companies in a group of publicly traded companies selected by the Compensation Committee. For 2017, our peer group consisted of:
Best Buy | Home Depot | Target | ||
Cardinal Health | Johnson & Johnson | TJX Companies | ||
Costco Wholesale | Lowes | Wal-Mart | ||
CVS Health | Procter & Gamble | Walgreens Boots Alliance | ||
Express Scripts | Sysco |
Themake-up of the compensation peer group is reviewed annually and modified as circumstances warrant. The Compensation Committee modified the peer group in 2016 because of industry consolidation and other competitive forces. Previously, the Compensation Committee used a primary peer group consisting only of food and drug retailers. In addition, the Compensation Committee considered data from “general industry” companies provided by its independent compensation consultant, a representation of major publicly-traded companies of similar size and scope from outside the retail industry. This data provided reference points, particularly for senior executive positions where competition for talent extends beyond the retail sector. The new peer group includes a combination of food and drug retailers, other large retailers based on revenue size, and large consumer-facing companies. Median 2017 revenue for the peer group was $87.8 billion, compared to our 2017 revenue of $122.7 billion.
Considering the size of Kroger in relation to other peer group companies, the Compensation Committee believes that salaries paid to our NEOs should be competitively positioned relative to amounts paid by peer group companies for comparable positions. The Compensation Committee also aims to provide an annual cash bonus potential to our NEOs that, if achieved at superior levels, would cause total cash compensation to be meaningfully above the median. Actual payouts may be as low as zero if performance does not meet the baselines established by the Compensation Committee.
The independent members of the Board have the exclusive authority to determine the amount of the CEO’s compensation. In setting total compensation, the independent directors consider the median compensation of the peer group’s CEOs. With respect to the annual bonus, the independent directors make two determinations: (1) they determine the annual cash bonus potential that will be multiplied by the annual cash bonus payout percentage earned that is applicable to the NEOs and (2) the independent directors determine the annual cash bonus amount paid to the CEO by retaining discretion to reduce the annual cash bonus percentage payout the CEO would otherwise receive under the formulaic plan.
37
The Compensation Committee performs the same function and exercises the same authority as to the other NEOs. In its annual review of compensation for the NEOs the Compensation Committee:
The Compensation Committee does not make use of a formula, but both qualitatively and quantitatively considers each of the factors identified above in setting compensation.
Advisory Vote to Approve Executive Compensation
At the 2017 annual meeting, we held our seventh annual advisory vote on executive compensation. Over 93% of the votes cast were in favor of the advisory vote in 2017. The Compensation Committee believes it conveys our shareholders’ support of the Compensation Committee’s decisions and the existing executive compensation programs. The Compensation Committee made no material changes in the structure of our compensation programs for 2017 or our pay for performance philosophy. At the 2017 annual meeting, we held an advisory vote on the frequency of the advisory vote on executive compensation. Approximately 88% of the votes cast were in favor of an annual vote and accordingly, we will continue to have an annual advisory vote.
38
Stock Ownership Guidelines
To more closely align the interests of our officers and directors with your interests as shareholders, the Board has adopted stock ownership guidelines. These guidelines requirenon-employee directors, executive officers, and other key executives to acquire and hold a minimum dollar value of Kroger common shares as set forth below:
Position | Multiple | |
Chief Executive Officer | 5 times base salary | |
President and Chief Operating Officer | 4 times base salary | |
Executive Vice Presidents and Senior Vice Presidents | 3 times base salary | |
Group Vice Presidents, Division Presidents, and Other Designated Key Executives | 2 times base salary | |
Non-employee Directors | 5 times annual base cash retainer | |
All covered individuals are expected to achieve the target level within five years of appointment to their positions. Until the requirements are met, covered individuals, including the NEOs, must hold 100% of common shares issued pursuant to performance units earned, shares received upon the exercise of stock options and upon the vesting of restricted stock, except those necessary to pay the exercise price of the options and/or applicable taxes, and must retain all Kroger common shares unless the disposition is approved in advance by the CEO, or by the Board or Compensation Committee for the CEO.
Executive Compensation Recoupment Policy (Clawback)
If a material error of facts results in the payment to an executive officer at the level of Group Vice President or higher of an annual cash bonus or a long-term cash bonus in an amount higher than otherwise would have been paid, as determined by the Compensation Committee, then the officer, upon demand from the Compensation Committee, will reimburse Kroger for the amounts that would not have been paid if the error had not occurred. This recoupment policy applies to those amounts paid by Kroger within 36 months prior to the detection and public disclosure of the error. In enforcing the policy, the Compensation Committee will take into consideration all factors that it deems appropriate, including:
Compensation Policies as They Relate to Risk Management
As part of the Compensation Committee’s review of our compensation practices, the Compensation Committee considers and analyzes the extent to which risks arise from such practices and their impact on Kroger’s business. As discussed in this Compensation Discussion and Analysis, our policies and practices for compensating employees are designed to, among other things, attract and retain high quality and engaged employees. In this process, the Compensation Committee also focuses on minimizing risk through the implementation of certain practices and policies, such as the executive compensation recoupment policy, which is described above under “Executive Compensation Recoupment Policy (Clawback)”. Accordingly, we do not believe that our compensation practices and policies create risks that are reasonably likely to have a material adverse effect on Kroger.
39
Prohibition on Hedging and Pledging
After considering best practices related to ownership of company shares, the Board has adopted a policy prohibiting Kroger directors and executive officers from engaging, directly or indirectly, in the pledging of, hedging transactions in, or short sales of, Kroger securities.
Section 162(m) of the Internal Revenue Code
Prior to the effective date of the Tax Cuts and Jobs Act of 2017, Section 162(m) of the Code generally disallowed a federal tax deduction to public companies for compensation greater than $1 million paid in any tax year to specified executive officers unless the compensation was “qualified performance-based compensation” under that section. Pursuant to the Tax Cuts and Jobs Act of 2017, the exception for “qualified performance-based compensation” under Section 162(m) of the Code was eliminated with respect to all remuneration in excess of $1 million other than qualified performance based compensation pursuant to a written binding contract in effect on November 2, 2017 or earlier which was not modified in any material respect on or after such date (the legislation providing for such transition rule, the “Transition Rule”).
As a result, performance based compensation that the Compensation Committee structured in previous years with the intent of qualifying as performance-based compensation under Section 162(m) that will be paid after January 1, 2018 may not be fully deductible, depending on the application of the Transition Rule. The committee will—consistent with its past practice—continue to retain flexibility to design compensation programs that are in the best long-term interests of the company and our shareholders, with deductibility of compensation being one of a variety of considerations taken into account.
Compensation Committee Report
The Compensation Committee has reviewed and discussed with Kroger’s management the Compensation Discussion and Analysis contained in this proxy statement. Based on its review and discussions with management, the Compensation Committee has recommended to the Board that the Compensation Discussion and Analysis be included in Kroger’s proxy statement and incorporated by reference into its Annual Report on Form10-K.
Compensation Committee:
Clyde R. Moore, Chair
Susan J. Kropf
Jorge P. Montoya
James A. Runde
40
Executive Compensation Tables
Summary Compensation Table
The following table and footnotes provide information regarding the compensation of the NEOs for the fiscal years presented.
| Name and Principal Position(1) | Fiscal Year | Salary ($) | Stock Awards ($)(2) | Option Awards ($)(3) | Non-Equity Incentive Plan Compensation ($)(4) | Change in Pension Value and Nonqualified Deferred Compensation Earnings ($)(5) | All Other Compensation ($)(6) | Total ($) | ||||||||||||||||||||||||
W. Rodney McMullen | 2017 | 1,318,752 | 5,166,317 | 2,700,116 | 359,806 | 1,691,406 | 298,463 | 11,534,860 | ||||||||||||||||||||||||
Chairman and Chief | 2016 | 1,251,781 | 5,125,034 | 2,699,044 | 719,945 | 3,139,537 | 282,051 | 13,217,392 | ||||||||||||||||||||||||
Executive Officer
|
| 2015
|
|
| 1,216,665
|
|
| 4,332,252
|
|
| 2,300,092
|
|
| 2,999,693
|
|
| 618,033
|
|
| 279,656
|
|
| 11,746,391
|
| ||||||||
J. Michael Schlotman | 2017 | 898,316 | 1,973,228 | 1,040,846 | 207,136 | 873,808 | 242,637 | 5,235,971 | ||||||||||||||||||||||||
Executive Vice President | 2016 | 850,360 | 1,973,247 | 1,040,436 | 372,855 | 1,436,752 | 141,427 | 5,815,077 | ||||||||||||||||||||||||
and Chief Financial Officer
|
| 2015
|
|
| 793,825
|
|
| 2,489,148
|
|
| 1,040,847
|
|
| 1,394,752
|
|
| 44,163
|
|
| 148,104
|
|
| 5,910,839
|
| ||||||||
Michael J. Donnelly | 2017 | 817,967 | 2,230,028 | 780,637 | 183,832 | 1,032,483 | 247,149 | 5,292,096 | ||||||||||||||||||||||||
Executive Vice President | 2016 | 757,036 | 1,480,011 | 780,323 | 341,308 | 2,207,236 | 188,569 | 5,754,483 | ||||||||||||||||||||||||
and Chief Operating Officer
|
| 2015
|
|
| 700,684
|
|
| 1,919,013
|
|
| 585,529
|
|
| 1,274,152
|
|
| 321,545
|
|
| 175,112
|
|
| 4,976,035
|
| ||||||||
Christopher T. Hjelm | 2017 | 744,245 | 1,480,025 | 780,637 | 173,536 | 520 | 190,917 | 3,369,880 | ||||||||||||||||||||||||
Executive Vice President | 2016 | 706,567 | 1,480,011 | 780,323 | 326,280 | 832 | 151,201 | 3,445,214 | ||||||||||||||||||||||||
and Chief Information Officer
|
| 2015
|
|
| 653,368
|
|
| 1,992,003
|
|
| 780,633
|
|
| 1,302,852
|
|
| 168
|
|
| 138,145
|
|
| 4,867,169
|
| ||||||||
Stuart W. Aitken | 2017 | 721,328 | 1,275,567 | 262,612 | 160,015 | - | 110,363 | 2,529,884 | ||||||||||||||||||||||||
Group Vice President
| ||||||||||||||||||||||||||||||||
| (1) | Mr. Aitken became an NEO in 2017. |
| (2) | Amounts reflect the grant date fair value of restricted stock and performance units granted each fiscal year, as computed in accordance with FASB ASC Topic 718. The following table reflects the value of each type of award granted to the NEOs in 2017: |
| Name | Restricted Stock | Performance Units | ||||||||
Mr. McMullen
| $
| 3,750,010
|
| $
| 1,416,307
|
| ||||
Mr. Schlotman
| $
| 1,479,921
|
| $
| 493,307
|
| ||||
Mr. Donnelly
| $
| 1,860,019
|
| $
| 370,009
|
| ||||
Mr. Hjelm
| $
| 1,110,016
|
| $
| 370,009
|
| ||||
Mr. Aitken
| $
| 1,151,111
|
| $
| 124,456
|
| ||||
The grant date fair value of the performance units reflected in the stock awards column and in the table above is computed based on the probable outcome of the performance conditions as of the grant date. This amount is consistent with the estimate of aggregate compensation cost to be recognized by the Company over the three-year performance period of the award determined as of the grant date under FASB ASC Topic 718, excluding the effect of estimated forfeitures. The assumptions used in calculating the valuations are set forth in Note 12 to the consolidated financial statements in Kroger’s10-K for fiscal year 2017.
41
Assuming that the highest level of performance conditions is achieved, the aggregate fair value of the 2017 performance unit awards at the grant date is as follows:
| Name | Value of Performance Units Assuming Maximum Performance | ||||
Mr. McMullen | $2,832,614 | ||||
Mr. Schlotman | $ 986,614 | ||||
Mr. Donnelly | $ 740,018 | ||||
Mr. Hjelm | $ 740,018 | ||||
Mr. Aitken | $ 248,911 | ||||
| (3) | These amounts represent the aggregate grant date fair value of option awards computed in accordance with FASB ASC Topic 718. The assumptions used in calculating the valuations are set forth in Note 12 to the consolidated financial statements in Kroger’s10-K for fiscal year 2017. |
| (4) | Non-equity incentive plan compensation earned for 2017 consists of amounts earned under the 2017 performance-based annual cash bonus plan and the 2015 Long-Term Incentive Plan. |
| Name | Annual Cash Bonus | Long-Term Cash Bonus | ||||||||
Mr. McMullen |
|
$ 71,806 |
|
|
$ 288,000 |
| ||||
Mr. Schlotman |
|
$ 24,736 |
|
|
$ 182,400 |
| ||||
Mr. Donnelly |
|
$ 24,736 |
|
|
$ 159,096 |
| ||||
Mr. Hjelm |
|
$ 24,736 |
|
|
$ 148,800 |
| ||||
Mr. Aitken |
|
$ 16,160 |
|
|
$ 143,855 |
| ||||
In accordance with the terms of the 2017 performance-based annual cash bonus plan, Kroger paid 3.8% to the NEOs. These amounts were earned with respect to performance in 2017 and paid in March 2018. See “Results of 2017 Annual Cash Bonus Plan” in the Compensation Discussion and Analysis (“CD&A”) for more information on this plan.
The long-term cash bonus awarded under the 2015 Long-Term Incentive Plan is a performance-based bonus plan designed to reward participants for improving the long-term performance of the Company. The plan covered performance during fiscal years 2015, 2016 and 2017 and amounts earned under the plan were paid in March 2018. In accordance with the terms of the plan, participants earned and Kroger paid 24% of long-term cash bonus potentials. The long-term cash bonus potential equaled the participant’s salary in effect on the last day of fiscal 2014, and for Mr. Aitken, the day he became eligible for the plan. See “Results of 2015 Long-Term Incentive Plan” in the CD&A for more information on this plan.
| (5) | For 2017, the amounts reported consist of the aggregate change in the actuarial present value of each NEO’s accumulated benefit under a defined benefit pension plan (including supplemental plans), which applies to Messrs. McMullen, Schlotman, Donnelly and Hjelm, and preferential earnings on nonqualified deferred compensation, which applies to Messrs. McMullen, Donnelly and Hjelm. Mr. Aitken does not participate in a pension plan and neither Mr. Schlotman nor Mr. Aitken participate in a nonqualified deferred compensation plan. |
| Name | Change in Pension Value | Preferential Earnings on Nonqualified Deferred Compensation | ||||||||
Mr. McMullen | $ | 1,591,548 | $ | 99,858 | ||||||
Mr. Schlotman | $ | 873,808 | — | |||||||
Mr. Donnelly | $ | 1,026,782 | $ | 5,701 | ||||||
Mr. Hjelm | $ | 313 | $ | 207 | ||||||
Mr. Aitken | — | — | ||||||||
Change in Pension Value. These amounts represent the aggregate change in the actuarial present value of accumulated pension benefits. Pension values may fluctuate significantly from
42
year to year depending on a number of factors, including age, years of service, average annual earnings and the assumptions used to determine the present value, such as the discount rate. The increase in the actuarial present value of accumulated pension benefits for 2017 compared to 2016 is due to a lower discount rate and additional benefits accrued, as applicable. Please see the 2017 Pension Benefits section for further information regarding the assumptions used in calculating pension benefits.
Preferential Earnings on Nonqualified Deferred Compensation. Messrs. McMullen, Donnelly and Hjelm participate in The Kroger Co. Executive Deferred Compensation Plan (the “Deferred Compensation Plan”). Under the plan, deferred compensation earns interest at a rate representing Kroger’s cost often-year debt, as determined by the CEO and approved by the Compensation Committee prior to the beginning of each deferral year. For each participant, a separate deferral account is created each year and the interest rate established for that year is applied to that deferral account until the deferred compensation is paid out. If the interest rate established by Kroger for a particular year exceeds 120% of the applicable federal long-term interest rate that corresponds most closely to the plan rate, the amount by which the plan rate exceeds 120% of the corresponding federal rate is deemed to be above-market or preferential. In fifteen of the twenty-four years in which at least one NEO deferred compensation, the rate set under the plan for that year exceeds 120% of the corresponding federal rate. For each of the deferral accounts in which the plan rate is deemed to be above-market, Kroger calculates the amount by which the actual annual earnings on the account exceed what the annual earnings would have been if the account earned interest at 120% of the corresponding federal rate, and discloses those amounts as preferential earnings. Amounts deferred in 2017 earn interest at a rate higher than 120% of the corresponding federal rate; accordingly, there are preferential earnings on these amounts.
| (6) | Amounts reported in the “All Other Compensation” column for 2017 include the dollar value of premiums paid by the Company for life insurance, Company contributions to defined contribution retirement plans, dividend equivalents paid on earned performance units, and dividends paid on unvested restricted stock. The following table identifies the value of each benefit. |
Name
| Life
| Retirement Plan
| Payment of
| Dividends
| Other(b)
| |||||||||||||||
Mr. McMullen | $ | 94,386 | — | $ | 16,718 | $ | 187,359 | — | ||||||||||||
Mr. Schlotman | $ | 165,719 | — | $ | 8,247 | $ | 68,671 | — | ||||||||||||
Mr. Donnelly | $ | 147,823 | $ | 45,733 | $ | 4,639 | $ | 48,954 | — | |||||||||||
Mr. Hjelm | $ | 100,665 | $ | 36,043 | $ | 6,186 | $ | 48,023 | — | |||||||||||
Mr. Aitken | $ | 23,508 | $ | 48,824 | $ | 2,066 | $ | 24,898 | $ | 11,067 | ||||||||||
| (a) | Retirement plan contributions.The Company makes automatic and matching contributions to NEOs’ accounts under the applicable defined contribution plan on the same terms and using the same formulas as other participating employees. The Company also makes contributions to NEOs’ accounts under the applicable defined contribution plan restoration plan, which is intended to make up the shortfall in retirement benefits caused by the limitations on benefits to highly compensated individuals under the defined contribution plans in accordance with the Code. The aggregate amounts in the table above represent the following contributions for 2017: |
43
(b) Other. For each of Messrs. McMullen, Schlotman, Donnelly and Hjelm the total amount of other benefits was less than $10,000. For Mr. Aitken, this amount includes the dollar value of insurance premiums paid by the Company on accidental death and dismemberment insurance and long-term disability insurance and reimbursement of tax preparation fees and cell phone fees.
2017 Grants of Plan-Based Awards
The following table provides information about equity andnon-equity incentive awards granted to the NEOs in 2017.
Name
| Grant
| Estimated Future Payouts Incentive Plan Awards | Estimated Future Payouts Under Equity Incentive Plan Awards | All Other
| All Other
| Exercise
| Grant
| ||||||||||||||||||||||||||||||||||||||
Target
| Maximum
| Target
| Maximum
| ||||||||||||||||||||||||||||||||||||||||||
W. Rodney McMullen | $ | 1,889,623 | (1) | $ | 3,779,245 | (1) | |||||||||||||||||||||||||||||||||||||||
| $ | 57,488 | (2) | $ | 1,277,500 | (2) | ||||||||||||||||||||||||||||||||||||||||
| 7/13/2017 | 5,561 | 123,587 | $ | 1,416,307 | |||||||||||||||||||||||||||||||||||||||||
| 7/13/2017 | 163,613 | $ | 3,750,010 | ||||||||||||||||||||||||||||||||||||||||||
|
| 7/13/2017
|
|
| 573,127
|
| $
| 22.92
|
| $
| 2,700,116
|
| ||||||||||||||||||||||||||||||||||
J. Michael Schlotman | $ | 650,943 | (1) | $ | 1,301,887 | (1) | |||||||||||||||||||||||||||||||||||||||
| $ | 39,161 | (2) | $ | 870,240 | (2) | ||||||||||||||||||||||||||||||||||||||||
| 7/13/2017 | 1,937 | 43,046 | $ | 493,307 | |||||||||||||||||||||||||||||||||||||||||
| 7/13/2017 | 64,569 | $ | 1,479,921 | ||||||||||||||||||||||||||||||||||||||||||
|
| 7/13/2017
|
|
| 220,930
|
| $
| 22.92
|
| $
| 1,040,846
|
| ||||||||||||||||||||||||||||||||||
Michael J. Donnelly | $ | 650,943 | (1) | $ | 1,301,887 | (1) | |||||||||||||||||||||||||||||||||||||||
| $ | 34,763 | (2) | $ | 772,500 | (2) | ||||||||||||||||||||||||||||||||||||||||
| 7/13/2017 | 1,453 | 32,287 | $ | 370,009 | |||||||||||||||||||||||||||||||||||||||||
| 7/13/2017 | 48,430 | $ | 1,110,016 | ||||||||||||||||||||||||||||||||||||||||||
| 12/7/2017 | 28,270 | $ | 750,003 | ||||||||||||||||||||||||||||||||||||||||||
|
| 7/13/2017
|
|
| 165,698
|
| $
| 22.92
|
| $
| 780,637
|
| ||||||||||||||||||||||||||||||||||
Christopher T. Hjelm | $ | 650,943 | (1) | $ | 1,301,887 | (1) | |||||||||||||||||||||||||||||||||||||||
| $ | 32,445 | (2) | $ | 721,000 | (2) | ||||||||||||||||||||||||||||||||||||||||
| 7/13/2017 | 1,453 | 32,287 | $ | 370,009 | |||||||||||||||||||||||||||||||||||||||||
| 7/13/2017 | 48,430 | $ | 1,110,016 | ||||||||||||||||||||||||||||||||||||||||||
|
| 7/13/2017
|
|
| 165,698
|
| $
| 22.92
|
| $
| 780,637
|
| ||||||||||||||||||||||||||||||||||
Stuart W. Aitken | $ | 425,250 | (1) | $ | 850,500 | (1) | |||||||||||||||||||||||||||||||||||||||
| $ | 31,286 | (2) | $ | 695,250 | (2) | ||||||||||||||||||||||||||||||||||||||||
| 7/13/2017 | 489 | 10,860 | $ | 124,456 | |||||||||||||||||||||||||||||||||||||||||
| 7/13/2017 | 17,500 | $ | 401,100 | ||||||||||||||||||||||||||||||||||||||||||
| 7/13/2017 | 32,723 | $ | 750,011 | ||||||||||||||||||||||||||||||||||||||||||
|
| 7/13/2017
|
|
| 55,742
|
| $
| 22.92
|
| $
| 262,612
|
| ||||||||||||||||||||||||||||||||||
| (1) | These amounts relate to the 2017 performance-based annual cash bonus plan. The amount listed under “Target” represents the annual cash bonus potential of the NEO. By the terms of the plan, payouts are limited to no more than 200% of a participant’s annual cash bonus potential; accordingly, the amount listed under “Maximum” is two times that officer’s annual cash bonus potential amount. Each NEO’s target and maximum amounts are prorated to reflect his increased annual cash bonus potential following the annual compensation review. The amounts actually earned under this plan were paid in March 2018 and are included in the |
44
| Summary Compensation Table for 2017 in the“Non-Equity Incentive Plan Compensation” column and are described in footnote 4 to that table. |
| (2) | These amounts relate to the long-term cash bonus potential under the 2017 Long-Term Incentive Plan, which covers performance during fiscal years 2017, 2018 and 2019. The long-term cash bonus potential amount equals the annual base salary of the NEOs as of the last day of fiscal 2016. By the terms of the plan, payouts are limited to no more than 100% of a participant’s long-term cash bonus potential; accordingly, the amount listed under “Maximum” is the participant’s long-term cash bonus potential. Because the actual payout is based on the level of performance achieved, the target amount is not determinable and therefore, in accordance with SEC rules, the amount listed under “Target” is a representative amount based on 2017 performance. |
| (3) | These amounts represent performance units awarded under the 2017 Long-Term Incentive Plan, which covers performance during fiscal years 2017, 2018 and 2019. The amount listed under “Maximum” represents the maximum number of common shares that can be earned by the NEO under the award. Because the actual payout is based on the level of performance achieved, the target amount is not determinable and therefore, in accordance with SEC rules, the amount listed under “Target” is a representative amount based on 2017 performance. The grant date fair value reported in the last column is based on the probable outcome of the performance conditions as of the grant date. This amount is consistent with the estimate of aggregate compensation cost to be recognized by the Company over the three-year performance period of the award determined as of the grant date under FASB ASC Topic 718, excluding the effect of estimated forfeitures. The aggregate grant date fair value of these awards is included in the Summary Compensation Table for 2017 in the “Stock Awards” column and described in footnote 2 to that table. |
| (4) | These amounts represent the number of shares of restricted stock granted in 2017. The aggregate grant date fair value reported in the last column is calculated in accordance with FASB ASC Topic 718. The aggregate grant date fair value of these awards is included in the Summary Compensation Table for 2017 in the “Stock Awards” column and described in footnote 2 to that table. |
| (5) | These amounts represent the number of stock options granted in 2017. Options are granted with an exercise price equal to the closing price of Kroger common shares on the grant date. The aggregate grant date fair value reported in the last column is calculated in accordance with FASB ASC Topic 718. The aggregate grant date fair value of these awards is included in the Summary Compensation Table for 2017 in the “Option Awards” column. |
The Compensation Committee, and the independent members of the Board in the case of the CEO, established the bonus potential amounts for the performance-based annual cash bonus awards (shown in this table as “Target”), the number of performance units awarded (shown in this table as “Maximum”), and the bonus potential amounts for the long-term cash bonus awards (shown in this table as “Maximum”). Amounts are payable to the extent that Kroger’s actual performance meets specific performance metrics established by the Compensation Committee at the beginning of the performance period. There are no guaranteed or minimum payouts; if none of the performance metrics are achieved, then none of the award is earned and no payout is made. As described in the CD&A, actual earnings under the performance-based annual cash bonus plan may exceed the target amount if the Company’s performance exceeds the performance goals, but are limited to 200% of the target amount. The performance units and the long-term cash bonus potentials awarded under the 2017 Long-Term Incentive Plan are more particularly described in the CD&A.
The annual restricted stock and nonqualified stock options awards granted to the NEOs vest in equal amounts on each of the first five anniversaries of the grant date, so long as the officer remains a Kroger employee. Mr. Donnelly’s 12/7/17 restricted stock award of 28,270 shares and Mr. Aitken’s 7/13/17 restricted stock award of 32,373 shares were special awards that vest 25% on each of the first two anniversaries of the grant date and 50% on the third anniversary of the grant date. Any dividends declared on Kroger common shares are payable on unvested restricted stock.
45
2017 Outstanding Equity Awards at FiscalYear-End
The following table provides information about outstanding equity-based incentive compensation awards for the NEOs as of the end of 2017. The vesting schedule for each award is described in the footnotes to this table. The market value of unvested restricted stock and unearned performance units is based on the closing price of Kroger’s common shares of $29.34 on February 2, 2018, the last trading day of 2017.
| Option Awards | Stock Awards | |||||||||||||||||||||||||||||||
| Name | Number of Securities Underlying Unexercised Options Exercisable (#) | Number of Securities Underlying Unexercised Options Unexercisable (#) | Option Exercise Price ($) | Option Expiration Date | Number of Shares or Units of Stock That Have Not Vested (#) | Market Value of Shares or Units of Stock That Have Not Vested ($) | Equity Incentive Plan Awards: Number of Unearned Shares, Units or Other Rights That Have Not Vested (#) | Equity Incentive Plan Awards: Market or Payout Value of Unearned Shares, Units or Other Rights That Have Not Vested ($) | ||||||||||||||||||||||||
W. Rodney | 130,000 | — | $14.31 | 6/26/2018 | 14,616 | (6) | $428,833 | 0 | (15) | $0 | (15) | |||||||||||||||||||||
McMullen | 130,000 | — | $11.17 | 6/25/2019 | 32,000 | (7) | $938,880 | 5,561 | (16) | $171,458 | (16) | |||||||||||||||||||||
| 140,000 | — | $10.08 | 6/24/2020 | 45,000 | (8) | $1,320,300 | ||||||||||||||||||||||||||
| 182,880 | — | $12.37 | 6/23/2021 | 51,657 | (9) | $1,515,616 | ||||||||||||||||||||||||||
| 194,880 | — | $10.98 | 7/12/2022 | 80,044 | (10) | $2,348,491 | ||||||||||||||||||||||||||
| 155,904 | 38,976 | (1) | $18.88 | 7/15/2023 | 163,613 | (11) | $4,800,405 | |||||||||||||||||||||||||
| 180,000 | 120,000 | (2) | $24.67 | 7/15/2024 | ||||||||||||||||||||||||||||
| 94,166 | 141,249 | (3) | $38.33 | 7/15/2025 | ||||||||||||||||||||||||||||
| 71,618 | 286,473 | (4) | $37.48 | 7/13/2026 | ||||||||||||||||||||||||||||
|
| —
|
|
| 573,127
| (5)
|
| $22.92
|
|
| 7/13/2027
|
| |||||||||||||||||||||
J. Michael | 50,000 | — | $10.08 | 6/24/2020 | 8,196 | (6) | $240,471 | 0 | (15) | $0 | (15) | |||||||||||||||||||||
Schlotman | 91,280 | — | $12.37 | 6/23/2021 | 12,000 | (8) | $352,080 | 1,937 | (16) | $59,720 | (16) | |||||||||||||||||||||
| 109,280 | — | $10.98 | 7/12/2022 | 23,166 | (9) | $679,690 | ||||||||||||||||||||||||||
| 87,424 | 21,856 | (1) | $18.88 | 7/15/2023 | 4,445 | (12) | $130,416 | |||||||||||||||||||||||||
| 48,000 | 32,000 | (2) | $24.67 | 7/15/2024 | 31,589 | (10) | $926,821 | |||||||||||||||||||||||||
| 42,612 | 63,919 | (3) | $38.33 | 7/15/2025 | 64,569 | (11) | $1,894,454 | |||||||||||||||||||||||||
| 27,607 | 110,431 | (4) | $37.48 | 7/13/2026 | ||||||||||||||||||||||||||||
| — | 220,930 | (5) | $22.92 | 7/13/2027 | ||||||||||||||||||||||||||||
Michael J. | 40,000 | — | $10.08 | 6/24/2020 | 4,804 | (6) | $140,949 | 0 | (15) | $0 | (15) | |||||||||||||||||||||
Donnelly | 70,720 | — | $12.37 | 6/23/2021 | 9,000 | (8) | $264,060 | 1,453 | (16) | $44,793 | (16) | |||||||||||||||||||||
| 50,720 | — | $10.98 | 7/12/2022 | 17,729 | (9) | $520,169 | ||||||||||||||||||||||||||
| 40,576 | — | $18.88 | 7/15/2023 | 4,445 | (12) | $130,416 | ||||||||||||||||||||||||||
| 36,000 | 24,000 | (2) | $24.67 | 7/15/2024 | 23,693 | (10) | $695,153 | |||||||||||||||||||||||||
| 23,971 | 35,958 | (3) | $38.33 | 7/15/2025 | 48,430 | (11) | $1,420,936 | |||||||||||||||||||||||||
| 20,705 | 82,823 | (4) | $37.48 | 7/13/2026 | 28,270 | (13) | $829,442 | |||||||||||||||||||||||||
|
| —
|
|
| 165,698
| (5)
|
| $22.92
|
|
| 7/13/2027
|
| |||||||||||||||||||||
Christopher T. | 16,000 | — | $11.17 | 6/25/2019 | 3,804 | (6) | $111,609 | 0 | (15) | $0 | (15) | |||||||||||||||||||||
Hjelm | 24,000 | — | $10.08 | 6/24/2020 | 9,000 | (8) | $264,060 | 1,453 | (16) | $44,793 | (16) | |||||||||||||||||||||
| 40,576 | — | $12.37 | 6/23/2021 | 17,376 | (9) | $509,812 | ||||||||||||||||||||||||||
| 50,720 | — | $10.98 | 7/12/2022 | 4,445 | (12) | $130,416 | ||||||||||||||||||||||||||
| 40,576 | 10,144 | (1) | $18.88 | 7/15/2023 | 23,693 | (10) | $695,153 | |||||||||||||||||||||||||
| 36,000 | 24,000 | (2) | $24.67 | 7/15/2024 | 48,430 | (11) | $1,420,936 | |||||||||||||||||||||||||
| 31,959 | 47,939 | (3) | $38.33 | 7/15/2025 | ||||||||||||||||||||||||||||
| 20,705 | 82,823 | (4) | $37.48 | 7/13/2026 | ||||||||||||||||||||||||||||
|
| —
|
|
| 165,698
| (5)
|
| $22.92
|
|
| 7/13/2027
|
| |||||||||||||||||||||
Stuart W. Aitken | 8,930 | 13,396 | (3) | $38.33 | 7/15/2025 | 4,853 | (9) | $142,387 | 0 | (15) | $0 | (15) | ||||||||||||||||||||
| 6,965 | 27,863 | (4) | $37.48 | 7/13/2026 | 6,667 | (6) | $195,610 | 489 | (16) | $15,067 | (16) | |||||||||||||||||||||
| — | 55,742 | (5) | $22.92 | 7/13/2027 | 8,562 | (10) | $251,209 | |||||||||||||||||||||||||
| 17,500 | (11) | $513,450 | ||||||||||||||||||||||||||||||
|
| 32,723
| (14)
|
| $960,093
|
| |||||||||||||||||||||||||||
| (1) | Stock options vest on 7/15/2018. |
| (2) | Stock options vest in equal amounts on 7/15/2018 and 7/15/2019. |
46
| (3) | Stock options vest in equal amounts on 7/15/2018, 7/15/2019, and 7/15/2020. |
| (4) | Stock options vest in equal amounts on 7/13/2018, 7/13/2019, 7/13/2020, and 7/13/2021. |
| (5) | Stock options vest in equal amounts on 7/13/2018, 7/13/2019, 7/13/2020, 7/13/2021 and 7/13/2022. |
| (6) | Restricted stock vests on 7/15/2018. |
| (7) | Restricted stock vests on 12/12/2018. |
| (8) | Restricted stock vests in equal amounts on 7/15/2018 and 7/15/2019. |
| (9) | Restricted stock vests in equal amounts on 7/15/2018, 7/15/2019, and 7/15/2020. |
| (10) | Restricted stock vests in equal amounts on 7/13/2018, 7/13/2019, 7/13/2020, and 7/13/2021. |
| (11) | Restricted stock vests in equal amounts on 7/13/2018, 7/13/2019, 7/13/2020, 7/13/2021 and 7/13/2022. |
| (12) | Restricted stock vests on 9/17/2018. |
| (13) | Restricted stock vests 25% on each of 12/7/2018 and 12/7/2019 and 50% on 12/7/2020. |
| (14) | Restricted stock vests 25% on each of 7/13/2018 and 7/13/2019 and 50% on 7/13/2020. |
| (15) | Performance units granted under the 2016 Long-Term Incentive Plan are earned as of the last day of fiscal 2018, to the extent performance conditions are achieved. Because the awards earned are not currently determinable, in accordance with SEC rules, the number of units and the corresponding market value reflect performance through 2017, including cash payments equal to projected dividend equivalent payments. |
| (16) | Performance units granted under the 2017 Long-Term Incentive Plan are earned as of the last day of fiscal 2019, to the extent performance conditions are achieved. Because the awards earned are not currently determinable, in accordance with SEC rules, the number of units and the corresponding market value reflect performance through 2017, including cash payments equal to projected dividend equivalent payments. |
2017 Option Exercises and Stock Vested
The following table provides information regarding 2017 stock options exercised, restricted stock vested, and common shares issued pursuant to performance units earned under the 2015 Long-Term Incentive Plan.
| Option Awards(1) | Stock Awards(2) | |||||||||||||||
Name | Number of Shares Acquired on Exercise (#) | Value Realized on Exercise ($) | Number of Shares Acquired on Vesting (#) | Value Realized on Vesting ($) | ||||||||||||
W. Rodney McMullen | 120,000 | $ | 2,176,200 | 133,484 | $ | 3,180,600 | ||||||||||
J. Michael Schlotman | — | — | 60,634 | $ | 1,390,177 | |||||||||||
Michael J. Donnelly | 80,000 | $ | 1,406,776 | 32,860 | $ | 750,535 | ||||||||||
Christopher T. Hjelm | 8,000 | $ | 130,680 | 32,902 | $ | 752,208 | ||||||||||
Stuart W. Aitken | — | — | 12,087 | $ | 278,971 | |||||||||||
| (1) | Stock options have aten-year life and expire if not exercised within thatten-year period. The value realized on exercise is the difference between the exercise price of the option and the closing price of Kroger’s common shares on the exercise date. |
47
| (2) | The Stock Awards columns include vested restricted stock and earned performance units, as follows: |
| Vested Restricted Stock | Earned Performance Units | |||||||||||||||
Name | Number of Shares | Value Realized | Number of Shares | Value Realized | ||||||||||||
Mr. McMullen | 120,961 | $ | 2,884,682 | 12,523 | $ | 295,918 | ||||||||||
Mr. Schlotman | 54,456 | $ | 1,244,200 | 6,178 | $ | 145,977 | ||||||||||
Mr. Donnelly | 29,385 | $ | 668,416 | 3,475 | $ | 82,119 | ||||||||||
Mr. Hjelm | 28,268 | $ | 642,714 | 4,634 | $ | 109,494 | ||||||||||
Mr. Aitken | 10,425 | $ | 239,687 | 1,662 | $ | 39,284 | ||||||||||
Restricted stock. The table includes the number of shares acquired upon vesting of restricted stock and the value realized on the vesting of restricted stock, based on the closing price of Kroger common shares on the vesting date.
Performance Units. In 2015, participants in the 2015 Long-Term Incentive Plan were awarded performance units that were earned based on performance criteria established by the Compensation Committee at the beginning of the three-year performance period. Actual payouts were based on the level of performance achieved, and were paid in common shares. The number of common shares issued and the value realized based on the closing price of Kroger common shares of $23.63 on March 15, 2018, the date of deemed delivery of the shares, are reflected in the table above.
2017 Pension Benefits
The following table provides information regarding pension benefits for the NEOs as of the last day of 2017. Mr. Aitken does not participate in a pension plan.
Name | Plan Name | Number of Years Credited Service (#) | Present Value of Accumulated Benefit ($)(1) | Payments during Last fiscal year ($) | ||||||||||
W. Rodney McMullen | Pension Plan | 32 | $ | 1,412,451 | — | |||||||||
| Excess Plan | 32 | $ | 14,576,108 | — | ||||||||||
J. Michael Schlotman | Pension Plan | 32 | $ | 1,520,588 | — | |||||||||
| Excess Plan | 32 | $ | 7,416,810 | — | ||||||||||
Michael J. Donnelly | Pension Plan | 38 | $ | 754,056 | — | |||||||||
| Excess Plan | 38 | $ | 5,960,476 | — | ||||||||||
Christopher T. Hjelm | Pension Plan | — | — | (2) | — | (2) | ||||||||
| (1) | The discount rate used to determine the present values was 3.99% for each of The Kroger Consolidated Retirement Benefit Plan Spin Off (the “Pension Plan”) and The Kroger Co. Consolidated Retirement Excess Benefit Plan (the “Excess Plan”), which are the same rates used at the measurement date for financial reporting purposes. Additional assumptions used in calculating the present values are set forth in Note 15to the consolidated financial statements in Kroger’s10-K for fiscal year 2017. |
| (2) | In 2017, the cash balance portion of the Pension Plan was terminated and Mr. Hjelm’s balance was distributed via a transfer to an annuity contract on December 5, 2017. Accordingly, Mr. Hjelm is no longer a participant in the Pension Plan and had no present value of accumulated benefits on |
48
| the last day of 2017. See the narrative discussion following this table under the heading “Cash Balance Participants” for additional information on the termination of the Pension Plan for cash balance participants. |
Pension Plan and Excess Plan
In 2017, Messrs. McMullen, Schlotman, Donnelly and Hjelm were participants in the Pension Plan, which is a qualified defined benefit pension plan. Messrs. McMullen, Schlotman and Donnelly also participate in the Excess Plan, which is a nonqualified deferred compensation plan as defined in Section 409A of the Code. The purpose of the Excess Plan is to make up the shortfall in retirement benefits caused by the limitations on benefits to highly compensated individuals under the qualified defined benefit pension plans in accordance with the Code.
Although participants generally receive credited service beginning at age 21, certain participants in the Pension Plan and the Excess Plan who commenced employment prior to 1986, including Messrs. McMullen and Schlotman, began to accrue credited service after attaining age 25 and one year of service. The Pension Plan and the Excess Plan generally determine accrued benefits using a cash balance formula, but retain benefit formulas applicable under prior plans for certain “grandfathered participants” who were employed by Kroger on December 31, 2000. Each of Messrs. McMullen, Schlotman and Donnelly is eligible for these grandfathered benefits. Mr. Hjelm is not a grandfathered participant, and therefore, his benefits are determined using the cash balance formula.
Grandfathered Participants
Benefits for grandfathered participants are determined using formulas applicable under prior plans, including the Kroger formula covering service to The Kroger Co. and the Dillon formula covering service to Dillon Companies, Inc. As “grandfathered participants”, Messrs. McMullen, Schlotman and Donnelly will receive benefits under the Pension Plan and the Excess Plan, determined as follows:
| • | 1 1⁄2% times years of credited service multiplied by the average of the highest five years of total earnings (base salary and annual cash bonus) during the last ten calendar years of employment, reduced by 1 1⁄4% times years of credited service multiplied by the primary social security benefit; |
| • | benefits payable between ages 55 and 62 will be reduced by 1⁄3 of one percent for each of the first 24 months and by 1⁄2 of one percent for each of the next 60 months by which the commencement of benefits precedes age 62. |
In the event of a termination of employment other than death or disability, Messrs. McMullen, Schlotman and Donnelly currently are eligible for a reduced early retirement benefit, as each has attained age 55. If a “grandfathered participant” becomes disabled while employed by Kroger and after attaining age 55, the participant will receive the full retirement benefit. If a married “grandfathered participant” dies while employed by Kroger, the surviving spouse will receive benefits as though a retirement occurred on such date, based on the greater of: actual benefits payable to the participant if he or she was over age 55, or the benefits that would have been payable to the participant assuming he or she was age 55 on the date of death.
Cash Balance Participants
Mr. Hjelm began participating in the Pension Plan in August 2005 as a cash balance participant. Until the plan was frozen on December 31, 2006, cash balance participants received an annual pay credit equal to 5% of that year’s eligible earnings plus an annual interest credit equal to the account balance at the beginning of the plan year multiplied by the annual rate of interest on30-year Treasury Securities in effect prior to the plan year. Beginning on January 1, 2007, cash balance participants receive an annual interest credit but no longer receive an annual pay credit.
49
In 2017, the Company terminated the Pension Plan with respect to activenon-union cash balance participants and distributed the current balance of each eligible participant, at his/her election, via a transfer to a 401(k) plan, IRA or a lump sum cash payment. Participants that did not make an election had their balance transferred to an insurer through an annuity contract. On December 5, 2017, Mr. Hjelm’s balance of $11,407.48 was distributed via transfer to an annuity contract. Mr. Hjelm is no longer a participant in the Pension Plan.
Offsetting Benefits
Mr. Donnelly also participates in the Dillon Companies, Inc. Employees’ Profit Sharing Plan (the “Dillon Profit Sharing Plan”), which is a qualified defined contribution plan under which Dillon Companies, Inc. and its participating subsidiaries may choose to make discretionary contributions each year that are allocated to each participant’s account. Participation in the Dillon Profit Sharing Plan was frozen in 2001 and participants are no longer able to make employee contributions, but certain participants, including Mr. Donnelly, are still eligible for employer contributions. Participants elect from among a number of investment options and the amounts in their accounts are invested and credited with investment earnings in accordance with their elections. Due to offset formulas contained in the Pension Plan, Mr.��Donnelly’s accrued benefits under the Dillon Profit Sharing Plan offset a portion of the benefit that would otherwise accrue for him under the Pension Plan for his service with Dillon Companies, Inc. Mr. Donnelly also participates in the Dillon Companies, Inc. Excess Benefit Profit Sharing Plan (“Dillon Excess Profit Sharing Plan”) which provides Company contributions in excess of the qualified plan limits. The Dillon Excess Profit Sharing Plan is offset by Mr. Donnelly’s benefit from the Excess Plan. The offsets are reflected in the Pension Benefits table above.
2017 Nonqualified Deferred Compensation
The following table provides information on nonqualified deferred compensation for the NEOs for 2017. Messrs. Schlotman and Aitken do not participate in a nonqualified deferred compensation plan.
Name | Executive Contributions in Last FY | Aggregate Earnings in Last FY(1) | Aggregate Balance at Last FYE(2) | |||||||||
W. Rodney McMullen | $ | 113,409 | (3) | $ | 618,075 | $ | 9,765,811 | |||||
J. Michael Schlotman | — | — | — | |||||||||
Michael J. Donnelly | $ | 111,014 | (4) | $ | 30,817 | $ | 540,667 | |||||
Christopher T. Hjelm | — | $ | 11,697 | $ | 259,712 | |||||||
Stuart W. Aitken | — | — | — | |||||||||
| (1) | These amounts include the aggregate earnings on all accounts for each NEO, including any above-market or preferential earnings. The following amounts earned in 2017 are deemed to be preferential earnings and are included in the “Change in Pension Value and Nonqualified Deferred Compensation Earnings” column of the Summary Compensation Table for 2017: Mr. McMullen, $99,858; Mr. Donnelly, $5,701; and Mr. Hjelm, $207. |
| (2) | The following amounts in the Aggregate Balance column were reported in the Summary Compensation Tables covering fiscal years 2006 – 2016: Mr. McMullen, $2,925,884; Mr. Donnelly, $134,959; and Mr. Hjelm, $149,163. |
| (3) | This amount includes the deferral of $5,417 of his salary in fiscal 2017; this amount is included in the “Salary” column of the Summary Compensation Table for 2017. This amount also includes the deferral of $56,925 of his 2014 Long-Term Incentive Plan cash bonus earned for performance over the three year period 2014 to 2016 and paid in March 2017 and the deferral of $51,067 of his 2016 performance-based annual cash bonus plan earned in 2016 and paid in March 2017; these amounts are included in the“Non-Equity Incentive Plan Compensation” column of the Summary Compensation Table for 2016. |
50
| (4) | This amount represents the deferral of a portion of his 2014 Long-Term Incentive Plan cash bonus earned for performance over the three year period 2014 to 2016 and paid in March 2017; this amount is included in the“Non-Equity Incentive Plan Compensation” column of the Summary Compensation Table for 2016. |
Executive Deferred Compensation Plan
Messrs. McMullen, Donnelly and Hjelm participate in the Deferred Compensation Plan, which is a nonqualified deferred compensation plan. Participants may elect to defer up to 100% of the amount of their salary that exceeds the sum of the FICA wage base andpre-tax insurance and other Code Section 125 plan deductions, as well as up to 100% of their annual and long-term cash bonus compensation. Kroger does not match any deferral or provide other contributions. Deferral account amounts are credited with interest at the rate representing Kroger’s cost often-year debt as determined by Kroger’s CEO and approved by the Compensation Committee prior to the beginning of each deferral year. The interest rate established for deferral amounts for each deferral year will be applied to those deferral amounts for all subsequent years until the deferred compensation is paid out. Amounts deferred in 2017 earn interest at a rate of 2.8%. Participants can elect to receive lump sum distributions or quarterly installments for periods up to ten years. Participants also can elect between lump sum distributions and quarterly installments to be received by designated beneficiaries if the participant dies before distribution of deferred compensation is completed.
Participants may not withdraw amounts from their accounts until they leave Kroger, except that Kroger has discretion to approve an early distribution to a participant upon the occurrence of an unforeseen emergency. Participants who are “specified employees” under Section 409A of the Code, which includes the NEOs, may not receive a post-termination distribution for at least six months following separation. If the employee dies prior to or during the distribution period, the remainder of the account will be distributed to his or her designated beneficiary in lump sum or quarterly installments, according to the participant’s prior election.
Potential Payments upon Termination or Change in Control
Kroger does not have employment agreements or other contracts, agreements, plans or arrangements that provide for payments to the NEOs in connection with a termination of employment or a change in control of Kroger. However, KEPP, award agreements for stock options, restricted stock and performance units, and the long-term cash bonus plans provide for certain payments and benefits to participants, including the NEOs, in the event of a termination of employment or a change in control of Kroger, as defined in the applicable plan or agreement. Our pension plan and nonqualified deferred compensation plan also provide for certain payments and benefits to participants in the event of a termination of employment, as described above in the 2017 Pension Benefits section and the 2017 Nonqualified Deferred Compensation section, respectively.
KEPP
KEPP applies to all management employees who are classified as exempt under the federal Fair Labor Standards Act and to certain administrative or technical support personnel who are not covered by a collective bargaining agreement, with at least one year of service, including the NEOs. KEPP provides severance benefits when a participant’s employment is terminated actually or constructively within two years following a change in control of Kroger, as defined in KEPP. The actual amount of the severance benefit is dependent on pay level and years of service. Exempt employees, including the NEOs, are eligible for the following benefits:
51
In the event that any payments or benefits received or to be received by an eligible employee in connection with a change in control or termination of employment (whether pursuant to KEPP or any other plan, arrangement or agreement with Kroger or any person whose actions result in a change in control) would constitute parachute payments within the meaning of Section 280G of the Code and would be subject to the excise tax under Section 4999 of the Code, then such payments and benefits will either be (i) paid in full or (ii) reduced to the minimum extent necessary to ensure that no portion of such payments or benefits will be subject to the excise tax, whichever results in the eligible employee receiving the greatest aggregate amount on anafter-tax basis.
Long-Term Incentive Awards
The following table describes the treatment of long-term incentive awards following a termination of employment or change in control of Kroger, as defined in the applicable agreement. In each case, the continued vesting, exercisability or eligibility for the incentive awards will end if the participant provides services to a competitor of Kroger.
Triggering Event | Stock Options | Restricted Stock | Performance Units | Performance-Based Cash Bonus | ||||
Involuntary | Forfeit all unvested options. Previously vested options remain exercisable for the shorter of one year after termination or the remainder of the original10-year term. | Forfeit all unvested shares | Forfeit all rights to units for which the three year performance period has not ended | Forfeit all rights to long-term cash bonuses for which the three year performance period has not ended | ||||
Voluntary - Prior to minimum | Forfeit all unvested options. Previously vested options remain exercisable for the shorter of one year after termination or the remainder of the original10-year term. | Forfeit all unvested shares | Forfeit all rights to units for which the three year performance period has not ended | Forfeit all rights to long-term cash bonuses for which the three year performance period has not ended | ||||
Voluntary - After minimum age | Unvested options continue vesting on the original schedule. All options are exercisable for remainder of the original10-year term. | Unvested shares continue vesting on the original schedule | Pro rata portion(1) of units earned based on performance results over the full three-year period | Pro rata portion(1) of long-term cash bonuses earned based on performance results over the full three-year period | ||||
Death | Unvested options are immediately vested. All options are exercisable for the remainder of the original10-year term. | Unvested shares immediately vest | Pro rata portion(1) of units earned based on performance results through the end of the fiscal year in which death occurs. Award will be paid following the end of such fiscal year. | Pro rata portion(1) of long-term cash bonuses earned based on performance results through the end of the fiscal year in which death occurs. Award will be paid following the end of such fiscal year. |
52
Triggering Event | Stock Options | Restricted Stock | Performance Units | Performance-Based Cash Bonus | ||||
Disability | Unvested options are immediately vested. All options are exercisable for remainder of the original10-year term. | Unvested shares immediately vest | Pro rata portion(1) of units earned based on performance results over the full three-year period | Pro rata portion(1) of long-term cash bonuses earned based on performance results over the full three-year period | ||||
Change in | Unvested options are immediately vested and exercisable | Unvested shares immediately vest | 50% of the units granted at the beginning of the performance period earned immediately | 50% of the bonus granted at the beginning of the performance period earned immediately |
| (1) | The prorated amount is equal to the number of weeks of active employment during the performance period divided by the total number of weeks in the performance period. |
| (2) | The minimum age requirement is age 62 for stock options and restricted stock and age 55 for performance units and the long-term cash bonus. |
| (3) | These benefits are payable upon a change in control of Kroger, as defined in the applicable agreement, with or without a termination of employment. |
Quantification of Payments upon Termination or Change in Control
The following table provides information regarding certain potential payments that would have been made to the NEOs if the triggering event occurred on the last day of the fiscal year, February 3, 2018, given compensation, age and service levels as of that date and, where applicable, based on the closing market price per Kroger common share on the last trading day of the fiscal year ($29.34 on February 2, 2018). Amounts actually received upon the occurrence of a triggering event will vary based on factors such as the timing during the year of such event, the market price of Kroger common shares, and the officer’s age, length of service and compensation level.
Name | Involuntary Termination | Voluntary Termination/ Retirement | Death | Disability | Change in Control without Termination | Change in Control with Termination | ||||||||||||||||||
W. Rodney McMullen | ||||||||||||||||||||||||
Accrued and Banked Vacation | $ | 705,370 | $ | 705,370 | $ | 705,370 | $ | 705,370 | $ | 705,370 | $ | 705,370 | ||||||||||||
Severance | — | — | — | — | — | 6,631,800 | ||||||||||||||||||
Continued Health and Welfare Benefits(1) | — | — | — | — | — | 69,946 | ||||||||||||||||||
Stock Options(2) | — | — | 4,648,164 | 4,648,164 | 4,648,164 | 4,648,164 | ||||||||||||||||||
Restricted Stock(3) | — | — | 11,352,526 | 11,352,526 | 11,352,526 | 11,352,526 | ||||||||||||||||||
Performance Units(4) | — | 54,402 | 54,402 | 54,402 | 2,889,403 | 2,889,403 | ||||||||||||||||||
Long-Term Cash Bonus(5) | — | 19,166 | 19,166 | 19,166 | 1,258,750 | 1,258,750 | ||||||||||||||||||
Executive Group Life Insurance | — | — | 5,213,600 | — | — | — | ||||||||||||||||||
J. Michael Schlotman | ||||||||||||||||||||||||
Accrued and Banked Vacation | $ | 479,564 | $ | 479,564 | $ | 479,564 | $ | 479,564 | $ | 479,564 | $ | 479,564 | ||||||||||||
Severance | — | — | — | — | — | 3,192,720 | ||||||||||||||||||
Continued Health and Welfare Benefits(1) | — | — | — | — | — | 104,012 | ||||||||||||||||||
Stock Options(2) | — | — | 1,796,584 | 1,796,584 | 1,796,584 | 1,796,584 | ||||||||||||||||||
Restricted Stock(3) | — | — | 4,223,933 | 4,223,933 | 4,223,933 | 4,223,933 | ||||||||||||||||||
Performance Units(4) | — | 18,948 | 18,948 | 18,948 | 1,017,658 | 1,017,658 | ||||||||||||||||||
53
Long-Term Cash Bonus(5) | — | 13,056 | 13,056 | 13,056 | 855,120 | 855,120 | ||||||||||||||||||
Executive Group Life Insurance | — | — | 50,000 | — | — | — | ||||||||||||||||||
Michael J. Donnelly | ||||||||||||||||||||||||
Accrued and Banked Vacation | $ | 211,530 | $ | 211,530 | $ | 211,530 | $ | 211,530 | $ | 211,530 | $ | 211,530 | ||||||||||||
Severance | — | — | — | — | — | 3,150,000 | ||||||||||||||||||
Continued Health and Welfare Benefits(1) | — | — | — | — | — | 85,275 | ||||||||||||||||||
Stock Options(2) | — | — | 1,282,087 | 1,282,087 | 1,282,087 | 1,282,087 | ||||||||||||||||||
Restricted Stock(3) | — | — | 4,001,125 | 4,001,125 | 4,001,125 | 4,001,125 | ||||||||||||||||||
Performance Units(4) | — | 14,212 | 14,212 | 14,212 | 763,295 | 763,295 | ||||||||||||||||||
Long-Term Cash Bonus(5) | — | 11,590 | 11,590 | 11,590 | 761,250 | 761,250 | ||||||||||||||||||
Executive Group Life Insurance | — | — | 3,132,800 | — | — | — | ||||||||||||||||||
Christopher T. Hjelm | ||||||||||||||||||||||||
Accrued and Banked Vacation | $ | 28,562 | $ | 28,562 | $ | 28,562 | $ | 28,562 | $ | 28,562 | $ | 28,562 | ||||||||||||
Severance | — | — | — | — | — | 2,885,208 | ||||||||||||||||||
Continued Health and Welfare Benefits(1) | — | — | — | — | — | 64,442 | ||||||||||||||||||
Stock Options(2) | — | — | 1,282,087 | 1,282,087 | 1,282,087 | 1,282,087 | ||||||||||||||||||
Restricted Stock(3) | — | — | 3,131,986 | 3,131,986 | 3,131,986 | 3,131,986 | ||||||||||||||||||
Performance Units(4) | — | 14,212 | 14,212 | 14,212 | 763,295 | 763,295 | ||||||||||||||||||
Long-Term Cash Bonus(5) | — | 10,817 | 10,817 | 10,817 | 710,500 | 710,500 | ||||||||||||||||||
Executive Group Life Insurance | — | — | 2,920,400 | — | — | — | ||||||||||||||||||
Stuart W. Aitken | ||||||||||||||||||||||||
Accrued and Banked Vacation | $ | 8,264 | $ | 8,264 | $ | 8,264 | $ | 8,264 | $ | 8,264 | $ | 8,264 | ||||||||||||
Severance | — | — | — | — | — | 2,027,000 | ||||||||||||||||||
Continued Health and Welfare Benefits(1) | — | — | — | — | — | 34,943 | ||||||||||||||||||
Stock Options(2) | — | — | 357,864 | 357,864 | 357,864 | 357,864 | ||||||||||||||||||
Restricted Stock(3) | — | — | 2,062,749 | 2,062,749 | 2,062,749 | 2,062,749 | ||||||||||||||||||
Performance Units(4) | — | — | 4,780 | 4,780 | 256,740 | 256,740 | ||||||||||||||||||
Long-Term Cash Bonus(5) | — | — | 10,431 | 10,431 | 685,125 | 685,125 | ||||||||||||||||||
Executive Group Life Insurance | — | — | 3,889,100 | — | — | — |
| (1) | Represents the aggregate present value of continued participation in the Company’s medical, dental and executive term life insurance plans, based on the premiums payable by the Company during the eligible period. The eligible period for continued medical and dental benefits is based on the level and length of service, which is 20 months for Mr. Aitken, and 24 months for the other NEOs. The eligible period for continued executive term life insurance coverage is six months for the NEOs. The amounts reported may ultimately be lower if the NEO is no longer eligible to receive benefits, which could occur upon obtaining other employment and becoming eligible for substantially equivalent benefits through the new employer. |
| (2) | Amounts reported in the death, disability and change in control columns represent the intrinsic value of the accelerated vesting of unvested stock options, calculated as the difference between the exercise price of the stock option and the closing price per Kroger common share on February 2, 2018. A value of $0 is attributed to stock options with an exercise price greater than the market price on the last day of the fiscal year. In accordance with SEC rules, no amount is reported in the voluntary termination/retirement column because vesting is not accelerated, but the options may continue to vest on the original schedule if the conditions described above are met. |
| (3) | Amounts reported in the death, disability and change in control columns represent the aggregate value of the accelerated vesting of unvested restricted stock. In accordance with SEC rules, no amount is reported in the voluntary termination/retirement column because vesting is not accelerated, but the restricted stock may continue to vest on the original schedule if the conditions described above are met. |
54
| (4) | Amounts reported in the voluntary termination/retirement, death and disability columns represent the aggregate value of the performance units granted in 2016 and 2017, based on performance through the last day of fiscal 2017 and prorated for the portion of the performance period completed. Amounts reported in the change in control column represent the aggregate value of 50% of the maximum number of performance units granted in 2016 and 2017. Awards under the 2015 Long-Term Incentive Plan were earned as of the last day of 2017 so each NEO age 55 or over was entitled to receive (regardless of the triggering event) the amount actually earned, which is reported in the Stock Awards column of the 2017 Stock Vested Table. |
| (5) | Amounts reported in the voluntary termination/retirement, death and disability columns represent the aggregate value of the long-term cash bonuses granted in 2016 and 2017, based on performance through the last day of fiscal 2017 and prorated for the portion of the performance period completed. Amounts reported in the change in control column represent the aggregate value of 50% of the long-term cash bonus potentials under the 2016 and 2017 Long-Term Incentive Plans. Awards under the 2015 Long-Term Incentive Plan were earned as of the last day of 2017, so each NEO age 55 or over was entitled to receive (regardless of the triggering event) the amount actually earned, which is reported in theNon-Equity Incentive Plan Compensation column of the Summary Compensation Table for 2017. |
CEO Pay Ratio
As required by Section 953(b) of the Dodd-Frank Wall Street Reform and Consumer Protection Act, and Item 402(u) of RegulationS-K, we are providing the following information regarding the ratio of the annual total compensation of our Chairman and CEO, Mr. McMullen, to the annual total compensation of our median employee.
As reported in the Summary Compensation Table, our CEO had annual total compensation for 2017 of $11,534,860. Using this Summary Compensation Table methodology, the annual total compensation of our median employee for 2017 was $21,075. As a result, we estimate that the ratio of our CEO’s annual total compensation to that of our median employee for fiscal 2017 was 547 to 1.
This pay ratio is a reasonable estimate calculated in a manner consistent with SEC rules based on our payroll records and the methodology described below. The SEC rules for identifying the median compensated employee and calculating the pay ratio based on that employee’s annual total compensation allow companies to adopt a variety of methodologies, to apply certain exclusions, and to make reasonable estimates and assumptions that reflect their compensation practices. As such, other companies may have different employment and compensation practices and may utilize different methodologies, exclusions, estimates and assumptions in calculating their own pay ratios. Therefore, the estimated pay ratio reported above may not be comparable to the pay ratios reported by other companies and should not be used as a basis for comparison between companies.
We identify the “median employee” from our employee population on the last day of our 11th fiscal period (December 2, 2017), which included full-time, part-time, temporary, and seasonal employees who were employed on that date. The consistently applied compensation measure we used was “base salary/wages paid”, which we measured from the beginning of our fiscal year, January 29, 2017, through December 2, 2017; and we multiplied the average weekly earnings during this period of each full-time and part-time permanent employee by 53, which was the number of weeks in fiscal 2017. We annualized the earnings of all permanent employees who were on a leave of absence or werenew-hires in 2017. We did not make any other adjustments permissible by the SEC nor did we make any other material assumptions or estimates to identify our median employee.
Once the median employee was identified, we then determined the median employee’s annual total compensation using the Summary Compensation Table methodology as detailed in Item 402(c)(2)(x) of RegulationS-K, and compared it to the annual total compensation of Mr. McMullen as detailed in the “Total” column of the Summary Compensation Table for 2017, to arrive at the pay ratio disclosed above.
55
Item No. 2 Advisory Vote to Approve Executive Compensation
You are being asked to vote, on an advisory basis, to approve the compensation of our NEOs. The Board of Directors recommends that you vote FOR the approval of compensation of our NEOs.
The Dodd-Frank Wall Street Reform and Consumer Protection Act, enacted in July 2010, requires that we give our shareholders the right to approve, on a nonbinding, advisory basis, the compensation of our NEOs as disclosed earlier in this proxy statement in accordance with the SEC’s rules.
As discussed earlier in the CD&A, our compensation philosophy is to attract and retain the best management talent and to motivate these employees to achieve our business and financial goals. Our incentive plans are designed to reward the actions that lead to long-term value creation. To achieve our objectives, we seek to ensure that compensation is competitive and that there is a direct link between pay and performance. To do so, we are guided by the following principles:
The vote on this resolution is not intended to address any specific element of compensation. Rather, the vote relates to the compensation of our NEOs as described in this proxy statement. The vote is advisory. This means that the vote is not binding on Kroger. The Compensation Committee of the Board is responsible for establishing executive compensation. In so doing, the Compensation Committee will consider, along with all other relevant factors, the results of this vote.
We ask our shareholders to vote on the following resolution:
“RESOLVED, that the compensation paid to the Company’s NEOs, as disclosed pursuant to Item 402 of RegulationS-K, including the Compensation Discussion and Analysis, compensation tables, and the related narrative discussion, is hereby APPROVED.”
The next advisory vote will occur at our 2019 annual meeting.
The Board of Directors Recommends a VoteFor This Proposal.
Item No. 3 Vote to Approve Amendment to Regulations to Permit Proxy Access
You are being asked to vote to approve an amendment to our Regulations to incorporate a provision that will permit proxy access nominations of directors to our Board of Directors. Our Board of Directors recommends that you vote FOR this proposal.
Under this Item No. 3, the Board is recommending that our shareholders adopt an amendment to our Regulations to implement proxy access. The proposed amendment is contained in a new Article I, Section 2(B)(3) to our Regulations, a copy of which is included in Appendix A attached to this Proxy Statement (the “Amendment”). Proxy access allows eligible shareholders to include their own nominees for director in the Company’s proxy materials along with the Board of Director’s nominees.
In connection with our review of our corporate governance practices and recent trends, in combination with views expressed by certain of our shareholders, the Board approved the Amendment. Pursuant to our Regulations, the Amendment will not become effective unless it is adopted by the
56
affirmative vote of a majority of our shareholders. The Board of Directors’ decision to approve and seek shareholder adoption of this proposal to implement proxy access reflects its continuing commitment to respond to the views of the Company’s shareholders and provide them with a voice in corporate governance matters. Furthermore, the Board of Directors believes that the implementation of proxy access in the manner set forth in this proposal will provide meaningful rights to our shareholders while ensuring the rights are used by shareholders in a responsible manner.
Description of Amendment
The following description of the Amendment is qualified in its entirety by reference to the complete text of the Amendment, which is included in the Regulations and set forth in Appendix A. You are urged to read the Amendment in its entirety.
Eligibility of Shareholders to Nominate Directors
The Amendment would permit any shareholder, or group of no more than 20 shareholders, owning 3 percent or more of our outstanding common shares continuously for at least the previous three years who complies with the requirements set forth in the provision, to include one director nominee in the Company’s proxy statement for its annual meeting of shareholders.
Calculation of Qualifying Ownership
To ensure that the interests of shareholders seeking to include director nominees in the Company’s proxy materials are aligned with those of other shareholders, a nominating shareholder would be deemed to own only those outstanding common shares of the Company as to which the shareholder possesses both the full voting and investment rights pertaining to the shares and the full economic interest in (including the opportunity for profit from and risk of loss on) such shares.
Number of Shareholder-Nominated Candidates
The maximum number of shareholder-nominated candidates that the Company would be required to include in its proxy materials would equal the greater of 2 or 20% of the directors in office at the time of nomination. If the 20% calculation does not result in a whole number, the maximum number of shareholder-nominated candidates would be the closest whole number below 20%. Based on our current Board of Directors size of 11 directors, the maximum number of shareholder-nominated candidates we would be required to include in our annual meeting proxy materials is two. If one or more vacancies occur on the Board, or the Board decides to reduce the size of the Board in connection therewith, after the nomination deadline, the nominee limit would be calculated based on the reduced number of directors. The maximum number of shareholder-nominated candidates would be reduced by candidates nominated under proxy access procedures who (i) are included in the Company’s proxy statement as a nominee of the Board of Directors, or (ii) were previously elected to the Board of Directors at one of the last two annual meetings and renominated as a director by the Board of Directors. In addition, such number will be further reduced (but not below one) by the number of director nominees submitted by shareholders pursuant to the Company’s advance notice nomination procedures.
Each nominating shareholder or group of shareholders may nominate one, but not more than one, director. If the number of shareholder-nominated candidates exceed the maximum permitted number of nominees, then such candidates would be included in the proxy material in order of the number of Company common shares (largest to smallest) held by each nominating shareholder or group of shareholders until the maximum is reached.
Nominating Procedure
In order to provide adequate time to assess shareholder nominated candidates, requests to include shareholder nominated candidates in the Company’s proxy materials must be received not
57
later than the close of business on the 120th calendar day nor earlier than the close of business on the 150th calendar day prior to the date on which the Company’s proxy statement for the prior year’s annual meeting of shareholders was first mailed to shareholders.
Information Required; Representations and Undertakings
Each shareholder seeking to include a shareholder-nominated candidate in the Company’s proxy materials would be required to provide certain information and make certain representations and undertakings at the time of nomination, including:
In addition, each shareholder-nominated candidate would be required to submit certain information, including as necessary to permit the Board of Directors to determine if the shareholder-nominated candidate is independent under the NYSE listing standards, any applicable rules of the SEC, or any publicly disclosed standards used by the Board of Directors in determining and disclosing the independence of the Company’s directors. Each shareholder-nominated candidate would also be required to provide certain representations and agreement, including in relation to adherence to applicable Company policies, disclosure of voting commitment or compensation arrangement in connection with his or her nomination or service as a director and the completion of any applicable questionnaires as requested by the Company.
Qualifications and Eligibility of Shareholder-Nominated Candidates
The Company would not be required to include the shareholder-nominated candidate in its proxy materials under certain circumstances, including if:
Renomination of Shareholder-Nominated Candidates
Any shareholder-nominated candidate who is included in the Company’s proxy materials, but subsequently withdraws from or becomes ineligible for election at the meeting, or does not receive at
58
least 25% of the vote cast in favor of his or her election would be ineligible for nomination for the following two annual meetings.
Supporting Statement
Nominating shareholders may submit to the Company for inclusion in the proxy materials a500-word statement in support of their nominee(s). The Company may omit any information or statement that it believes would violate any applicable law or regulation.
The Board of Directors Recommends a VoteFor This Proposal.
Item No. 4 Vote to Approve Amendment to Regulations to Permit Board Amendments in Accordance with Ohio Law
Under this Item No. 4, we are asking our shareholders to approve an amendment to our Regulations allowing the Board of Directors to adopt amendments to the Regulations to the extent permitted by Ohio law. Our Regulations currently require our shareholders to adopt all amendments.
The text of the revised Article VII of our Regulations, with the additional text proposed by the amendment indicated by underlining is set forth below. The following discussion is qualified in its entirety by reference to the proposed text of the amendment below.
Like many Ohio companies whose shareholders have voted to amend their regulations to permit amendments by their boards of directors, we are asking our shareholders to approve Proposal No. 4 in light of the following:
Even if Proposal 4 is approved, the Board’s ability to amend the Regulations will be limited. Under Ohio law, only our shareholders would be able to make the following amendments to our Regulations:
59
Accordingly, if shareholders approve Proposal 4:
The amendment also clarifies that the power to amend the Regulations, whether exercised by the Board or shareholders, includes the power to adopt new regulations.
If Proposal 4 is approved, we would promptly notify shareholders of any amendments to our Regulations made by the Board of Directors either by filing a report with the SEC or by sending a notice to shareholders of record as of the date of the adoption of the amendment. Our shareholders would continue to be able to adopt, amend and repeal the Regulations without action by the Board and, therefore, to change any amendment made by the Board of Directors should they determine that to be appropriate.
The actual text of the revised Article VII of our Regulations, with changes indicated by underlining, is set forth below. The amendment would become effective at the time of the shareholder vote.
ARTICLE VII
Amendment of Regulations
These regulations may be amended or repealed or new regulations may be adopted (A) at any meeting of the shareholders called for that purpose or without such meeting by the affirmative vote or consent of the holders of record of shares entitling them to exercise a majority of the voting power on such proposal except that the affirmative vote or consent of the holders of record of shares entitling them to exercise 75% of the voting power on such proposal shall be required to amend, alter, change or repeal Sections 1 or 5 of Article II or this Article VII, or to amend, alter, change or repeal these regulations in any way inconsistent with the intent of the foregoing provisions, or (B) by the Board of directors to the extent permitted by the Ohio Revised Code.
The Board of Directors Recommends a VoteFor This Proposal.
Item No. 5 Ratification of the Appointment of Kroger’s Independent Auditor
You are being asked to ratify the appointment of Kroger’s independent auditor, PricewaterhouseCoopers LLC. The Board of Directors recommends that you vote FOR the ratification of PricewaterhouseCoopers LLP as our independent registered public accounting firm.
The primary function of the Audit Committee is to assist the Board of Directors in fulfilling its oversight responsibilities regarding the Company’s financial reporting and accounting practices including the integrity of the Company’s financial statements; the Company’s compliance with legal and regulatory requirements; the independent public accountants’ qualifications and independence; the performance of the Company’s internal audit function and independent public accountants; and the preparation of the Audit Committee Report. The Audit Committee performs this work pursuant to a written charter approved by the Board of Directors. The Audit Committee charter most recently was revised during fiscal 2012 and is available on the Company’s website at ir.kroger.com under Corporate
60
Investors – Governance – Committee Composition. The Audit Committee has implemented procedures to assist it during the course of each fiscal year in devoting the attention that is necessary and appropriate to each of the matters assigned to it under the Audit Committee’s charter. The Audit Committee held five5 meetings during fiscal year 2015.2017.
Selection of Independent Auditor
The Audit Committee of the Board of Directors is directly responsible for the appointment, compensation, retention, and oversight of Kroger’s independent auditor, as required by law and by applicable NYSE rules. On March 9, 2016,14, 2018, the Audit Committee appointed PricewaterhouseCoopers LLP as Kroger’s independent auditor for the fiscal year ending January 28, 2017.February 2, 2019.
In determining whether to reappoint the independent auditor, our Audit Committee:
As a result, the members of the Audit Committee believe that the continued retention ofPricewaterhouseCoopersof PricewaterhouseCoopers LLP to serve as our independent registered public accounting firm is in the best interests of our company and its shareholders.
While shareholder ratification of the selection of PricewaterhouseCoopers LLP as our independent auditor is not required by Kroger’s Regulations or otherwise, the Board of Directors is submitting the selection of PricewaterhouseCoopers LLP to shareholders for ratification, as it has in past years, as a good corporate governance practice. If the shareholders fail to ratify the selection, the Audit Committee
54
may, but is not required to, reconsider whether to retain that firm. Even if the selection is ratified, the Audit Committee in its discretion may direct the appointment of a different auditor at any time during the year if it determines that such a change would be in the best interests of our company and our shareholders.
A representative of PricewaterhouseCoopers LLP is expected to be present at the meeting to respond to appropriate questions and to make a statement if he or she desires to do so.
61
Audit andNon-Audit Fees
The following table presents the aggregate fees billed for professional services performed by PricewaterhouseCoopers LLP for the annual audit and quarterly reviews of our consolidated financial statements for fiscal 20152017 and 2014,2016, and for audit-related, tax and all other services performed in 20152017 and 2014.2016.
| Fiscal Year Ended | ||||||||||
| January 30, 2016 | January 31, 2015 | |||||||||
| Audit Fees(1) | $ | 5,659,193 | $ | 5,250,203 | ||||||
| Audit-Related Fees(2) | — | 441,704 | ||||||||
| Tax Fees(3) | — | 360,498 | ||||||||
| All Other Fees(4) | — | 85,000 | ||||||||
| Total | $ | 5,659,193 | $ | 6,137,405 | ||||||
| Fiscal Year Ended | ||||||||
| February 3, 2018 | January 28, 2017 | |||||||
Audit Fees(1) | $ | 5,178,208 | $ | 5,894,384 | ||||
Audit-Related Fees | 775,000 | — | ||||||
Tax Fees(2) | 30,736 | |||||||
All Other Fees | 900 | — | ||||||
|
|
|
| |||||
Total | $ | 5,954,108 | $ | 5,925,120 | ||||
|
|
|
| |||||
| (1) | Includes annual audit and quarterly reviews of Kroger’s consolidated financial statements, the issuance of comfort letters to underwriters, consents, and assistance with review of documents filed with the SEC. | |
| (2) | ||
The Audit Committee requires that it approve in advance all audit andnon-audit work performed by PricewaterhouseCoopers LLP. On March 9, 2016, the Audit Committee approved services to be performed by PricewaterhouseCoopers LLP for the remainder of fiscal year 2015 that are related to the audit of Kroger or involve the audit itself. In 2007, the Audit Committee adopted an audit andnon-audit servicepre-approval policy. Pursuant to the terms of that policy, the Committee will annuallypre-approve certain defined services that are expected to be provided by the independent auditors. If it becomes appropriate during the year to engage the independent accountant for additional services, the Audit Committee must first approve the specific services before the independent accountant may perform the additional work.
PricewaterhouseCoopers LLP has advised the Audit Committee that neither the firm, nor any member of the firm, has any financial interest, direct or indirect, in any capacity in Kroger or its subsidiaries.
The Board of Directors Recommends a VoteFor This Proposal.
55
62
Audit Committee Report
Management of the Company is responsible for the preparation and presentation of the Company’s financial statements, the Company’s accounting and financial reporting principles and internal controls, and procedures that are designed to provide reasonable assurance regarding compliance with accounting standards and applicable laws and regulations. The independent public accountants are responsible for auditing the Company’s financial statements and expressing opinions as to the financial statements’ conformity with generally accepted accounting principles and the effectiveness of the Company’s internal control over financial reporting.
In performing its functions, the Audit Committee:
Based upon the review and discussions described in this report, the Audit Committee recommended to the Board of Directors that the audited consolidated financial statements be included in the Company’s Annual Report on Form10-K for the year ended January 30, 2016,February 3, 2018, as filed with the SEC.
This report is submitted by the Audit Committee.
Ronald L. Sargent, Chair
Anne GatesSusan J. KropfSusan M. Phillips
Bobby S. Shackouls
56Mark S. Sutton
Item No. 46 Shareholder Proposal
We have been notified by nine shareholders, the names and shareholdings – Recyclability of which will be furnished promptly to any shareholder upon written or oral request to Kroger’s Secretary at our executive offices, that they intend to propose the following resolution at the annual meeting:
The Kroger CompanyHuman Rights Risk Assessment - 2016
“RESOLVED, that shareholders of The Kroger Co. (“Kroger”) urge the Board of Directors to report to shareholders, at reasonable cost and omitting proprietary information, on Kroger’s process for identifying and analyzing potential and actual human rights risks of Kroger’s operations and supply chain (referred to herein as a “human rights risk assessment”) addressing the following:
The report should be made available to shareholders on Kroger’s website no later than October 31, 2016.
Supporting Statement
As long-term shareholders, we favor policies and practices that protect and enhance the value of our investments. There is increasing recognition that company risks related to human rights violations, such as litigation, reputational damage, and project delays and disruptions, can adversely affect shareholder value.
Kroger, like many other companies, has adopted a supplier code of conduct (See The Kroger Company Standard Vendor Agreement) but has yet to publish a company-wide Human Rights Policy, addressing human rights issues and a separate human rights code that applies to its suppliers. Adoption of these principles would be an important first step in effectively managing human rights risks. Companies must then assess risks to shareholder value of human rights practices in their operations and supply chains to translate principles into protective practices.
The importance of human rights risk assessment is reflected in the United Nations Guiding Principles on Business and Human Rights (the “Ruggie Principles”) approved by the UN Human Rights Council in 2011. The Ruggie Principles urge that “business enterprises should carry out human rights due diligence... assessing actual and potential human rights impacts, integrating and acting upon the findings, tracking responses, and communicating how impacts are addressed.” (http://www.business-humanrights.org/media/documents/ruggie/ruggie-guiding-principles-21-mar-2011.pdf)
Kroger’s business exposes it to significant human rights risks. As of year-end 2014, Kroger operations, including supermarkets, convenience and jewelry stores, are located in over 40 states. While over 90% of Kroger’s business is food its vendor Code of Conduct is based heavily on compliance with the law, and U.S. agricultural workers are excluded from many labor laws that apply to other U.S. workers. The company’s supply chain is complex and global and violations of human rights in Kroger’s supply chain can lead to negative publicity, public protests, and a loss of consumer confidence that can have a negative impact on shareholder value.
We urge shareholders to vote for this proposal.”
57
The Board of Directors Recommends a VoteAgainst This Proposal for the Following Reasons:
Like the proponents, the Board also recognizes the importance of ensuring that those seeking to do business with us respect basic human rights. However, the Board opposes this proposal because we are already working to ensure an ethical supply chain for the products sold in our stores and we have a zero tolerance policy for human rights violations. Furthermore, we regularly consider our policies and practices and we have recently taken several important steps to drive into our supply chain greater responsibility and accountability:
We expect our program to continue to evolve and develop based on input from suppliers, customers, government, non-governmental organizations and developments within the industry. We believe that these efforts represent significant and positive steps forward for our Company’s social responsibility program.
Kroger is already actively implementing, monitoring, and continually improving our policies and practices, addressing a number of the areas discussed by the proponent. We believe that preparation of an additional report would not be an efficient use of our shareholders’ resources. We urge you to voteAGAINST this proposal.
Item No. 5 Shareholder ProposalPackaging
We have been notified by one shareholder, the name and shareholdings of which will be furnished promptly to any shareholder upon written or oral request to Kroger’s Secretary at our executive offices, that it intends to propose the following resolution at the annual meeting:
58“
Shareholder ProposalRecyclability of Packaging
“WHEREAS: A portion of Kroger house brand product packaging is unrecyclable, including plastics, which are a growing component of plastic pollution and marine litter. Authorities say that marine litter kills and injures marine life, spreads toxics, and poses a potential threat to human health. The environmental cost of consumer plastic products and packaging exceeds $139 billion annually, according to the American Chemistry Council.
Plastic is the fastest growing form of packaging; U.S. flexible plastic sales are estimated at $26 billion. Dried fruit, frozen meat, cheese, and dog food are some of the Kroger house brand items
63
packaged in unrecyclable plastic pouches. Private label items account for a quarter of all sales - nearly–nearly $20 billion annually. Using unrecyclable packaging when recyclable alternatives are available wastes valuable resources. William McDonough, a leading green design advisor, calls pouch packaging a “monstrous hybrid” designed to end up either in a landfill or incinerator.
Recyclability of household packaging is a growing area of focus as consumers become more environmentally conscious, yet recycling rates stagnate. Only 14% of plastic packaging is recycled, according to the U.S. Environmental Protection Agency (EPA). Billions of pouches and similar multi-layer plastic laminates, representing significant embedded value, lie buried in landfills. Unrecyclable packaging is more likely to be littered and swept into waterways. A recentAn assessment of marine debris by a panel of the Global Environment Facility concluded that one cause of debris entering oceans is “design and marketing of products internationally without appropriate regard to their environmental fate or ability to be recycled...”
In the marine environment, plastics break down into indigestible particles that marine life mistake for food. Studies by the EPA suggest a synergistic effect between plastic debris and persistent,bio-accumulative, toxic chemicals. Plastics absorb toxics such as polychlorinated biphenyls and dioxins from water or sediment and transfer them to the marine food web and potentially to human diets. One study of fish from the North Pacific found one orIf no actions are taken, oceans are expected to contain more plastic chemicals in allthan fish tested, independent of location and species.by 2050!
California spends nearly $500 million annually preventing trash, much of it packaging, from polluting beaches, rivers and oceanfront. Making all packaging recyclable, if possible, is the first step needed to reduce the threat posed by ocean debris.
plastic pollution. Better management of plastic could save consumer goods companies $4 billion a year. Companies who aspire to corporate sustainability yet use these risky materials need to explain why they use unrecyclable packaging. Other companies who manufacture and sell food and household goods are moving towards recyclability. Walmart uses sustainable packaging guidelines to incentivize its suppliers to increase the amount of packaging they use that can be recycled. Colgate-Palmolive, PepsiCo, Procter & Gamble, Unilever, and Colgate-Palmolive agreed to make most of theirWalmart have all developed packaging recyclable by 2020. Keurig Green Mountain will make K-cup coffee pods recyclable; and McDonald’s and Dunkin Donuts shifted away from foam plastic cups, which cannot be readily recycled.recyclability goals.
RESOLVED: Shareowners of Kroger request that the board of directors issue a report, at reasonable cost, omitting confidential information, assessing the environmental impacts of continuing to use unrecyclable brand packaging.
Supporting Statement: Proponents believe that the report should include an assessment of the reputational, financial and operational risks associated with continuing to use unrecyclable brand packaging and, if possible, goals and a timeline to phase out unrecyclable packaging.”
The Board of Directors Recommends a VoteAgainst This Proposal for the Following Reasons:
Kroger shares the proponent’s concerns regarding plastic recyclability and recognizes the important role we playour company plays as a good steward of the environment.
environment, including efforts to reduce packaging and increase recyclability. We continuefocus on reducing waste through our commitment to improve the recyclabilitybe a Zero Waste Company (diverting at least 90% of waste from landfills) by 2020 (as of 2017, Kroger had diverted more than 75% of its waste), and as part of our Corporate Brand products, while still preserving their safetyZero Hunger I Zero Waste social impact plan to end hunger in our communities and quality. Moreeliminate waste across the company by 2025.
In 2016, Kroger announced its 2020 Sustainability Goals. One of these goals specifically we followfocuses on improvements in Our Brands packaging:
Goal: 100% Our Brands Packaging Optimization
By 2020, Kroger will optimize packaging in Our Brands by following a balanced, multi-pronged approach to optimizing packaging design that considers factors such asdesign attributes including but not limited to food safety, shelf life, availability, quality, material type and source, function, recyclability and cost, among others.cost. Through the design optimization process, Kroger will strive to increase the recyclability of Our Brands manufactured plastic packaging.
This goal has many parts. The detailed packaging optimization goals for 2020 and an update on our progress can be found at http://sustainability.kroger.com/2020-goals.html.
64
Source Reduction
The focus on Our Brands packaging is intended to reduce the amount of plastics in our packaging, increase recycled content and certified virgin fiber, plus increase recyclability.
The Our Brands packaging team is designing product packages that use less plastic, helping Kroger make significant progress on our goal to reduce plastic in Our Brands packaging by 10 million pounds by 2020. By the end of 2017, we reached the9.8-million-pound mark. Hence, Kroger is on track to achieve our goal well ahead of schedule.
The biggest example of source reduction is the redesign of Our Brands gallon milk jug. Our new milk jug still is made of the same 100% recyclable high density polyethylene as the old jugs, but our unique design allows us to use approximately 10% less plastic while retaining the same performance. This lighter-weight milk jug is currently in production at six Kroger dairies:
We will continue to roll out the new jug throughout 2018 at additional facilities. We will also continue to identify other projects to reduce packaging at the source and promote sustainable packaging across our operations.
Recycling Solutions
We also offer a popularin-store plastics recycling program for our customers – typically located in our store lobbies. We accept several types of Our Brands packaging, such as clean and dry plastic shopping bags, bread and produce bags, bottled water case wraps, and bathroom tissue and diaper plastic overwraps. We also accept national brand product packaging types that are increasingly labelingcompatible within-storedrop-off programs. In addition, Kroger associates use this program to recycle pallet shrink wrap. In 2017, we collected more than 37.9 million pounds of plastic through this program.
Customer Communication
We continue to improve our product labels as part of our packaging updates to help increase awareness among our customers about how to recycle our packaging. We label recyclable Corporate BrandOur Brands products peraccording to the Federal Trade Commission’s Green Guides, prompting our customers to “PLEASE RECYCLE.“Please Recycle.” One exampleAs we update our packaging labels, we clearly denote when packaging, such as plastic, paper and aluminum containers, is through our redesign of Kroger brand milks, creams and orange juices that come in quart, pint and
59
half-pint packages. The packaging for these products is comprised of a bottle made from #1 polyethylene terephthalate (PETE), one of the most widely recycled plastics available, andrecyclable. Where a shrink sleeve. While the shrink sleeve is also made from #1 PETE, these shrink sleeves may interfere with the abilityrecyclability of the bottles to be segregated and recycled when a recycling facility uses optical scanning technology. As a result, in order to increase the number of Corporate Brand #1 PETE bottles that can be properly recycled,plastic bottle, we have addedare adding a tear perforation and the consumer message “REMOVE LABEL TO RECYCLE BOTTLE,”“Remove Label to Recycle Bottle” to the shrink labels.
We recognize that creating lasting sustainable consumption patterns requires a comprehensive approach and so we also work with various industry experts and forums to advocate for expanded recycling infrastructure to support both multiple forms of Similarly, where products use plastic packaging and diversion from landfills.
Additionally, our banner brand bread bags are made from low-density polyethylene (LDPE). This type of plasticoverwrap that can be a contaminant in many single streamrecycled through ourin-store plastics recycling programs. To helpprograms, we are adding language to the overwrap that directs our customers recycle their LDPE bread bags we have added customer communication on the bag that reads,to “Please recycleRecycle at your local, Kroger Family of Storesdrop-off location.” These drop-off recycling bins are part of our plastic bag recycling program
Reusable Bags and are typically located in the front vestibule of our stores. Along with bread bags, customers can alsoPlastic Containers
While helping recycle clean and dry plastic bags, bottled water case wraps, bathroom tissue and diaper plastic overwraps, dry cleaningwe strongly advocate for transitioning to reusable bags and newspaper bags. This program is currently undergoing rebranding and expansion to encourage customers to recycle even morechange their habits by offering a wide variety of reusable bags; in 2016fact, each year, we sell millions of these reusable bags to our customers. Additionally, many parking lots at our Kroger Family of Stores have signs on the cart corrals that remind our customers to bring their reusable bags into our stores. Simple reminders like these can further reduce plastic bag waste and beyond.encourage customers to change their shopping habits.
For each
65
We also ship fresh produce to our stores using reusable plastic containers (RPCs), which improve product quality and significantly reduce waste by eliminating the use of cardboard boxes. We continue to increase our volume of fresh produce shipped in RPCs, and used 140 million containers in 2017.
Advocacy
We are actively engaging in industry collaboration groups and directly with our stakeholders on these topics. To accelerate efforts to achieve our packaging goals, Kroger joined the past several years we have published onlineSustainable Packaging Coalition in 2017. We believe our annualparticipation will accelerate our progress and help advance industry-wide and supply chain-wide initiatives to move the needle on recyclability and identify suppliers who can support our sustainable packaging goals.
Guided by our 2020 Sustainability Report that highlightsGoals and our sustainability initiatives and waste reduction efforts in greater detail, available at sustainability.kroger.com. In that report, we set forth a rigorous and tangible goal to strive to have zero waste in our retail locations. Through this initiative, and others, weZero Hunger I Zero Waste social impact plan, Kroger will continue to support efforts to reduceplastic waste reduction, find optimized solutions for packaging and advocatecreate opportunities for expanded recycling infrastructure asour associates and customers to recycle plastics in our stores. We will continue to optimize Our Brands packaging in ways that support our financial, environmental and social responsibilities to our customers, shareholders and other stakeholders.
The proposal asks that Kroger issue a report on unrecyclable packaging material. Kroger publishes details on our sustainability goals, initiatives, and progress against our targets in our Sustainability Report and on our website (http://sustainability.kroger.com). Given our extensive reporting and our strong focus on ensuring we believe these efforts are significantresponsible stewards of the environment, the Board believes that issuing a report on unrecyclable packaging would be unnecessary and meaningful. would consume time and resources that are best spent on executing on our sustainability programs and targets.
We urge you to support these efforts and voteAGAINST this proposal.
Item No. 6 Shareholder Proposal
We have been notified by two shareholders, the names and shareholdings of which will be furnished promptly to any shareholder upon written or oral request to Kroger’s Secretary at our executive offices, that they intend to propose the following resolution at the annual meeting:
Shareholder ProposalRenewable Energy
“Whereas:
To mitigate the worst impacts of climate change, the United Nations has stated that global warming must not increase more than 2 degrees Celsius beyond pre-industrial levels, which implies U.S. carbon dioxide emission reductions of 80% from 1990 levels by 2050. (IPCC 2013). At the 2015 United Nations Conference of Parties in Paris, 195 parties agreed on a pathway to achieve a 2 degree limit.
At $108 billion in sales, Kroger is the 6th largest global retailer, and is 20th on Fortune’s 2015 Fortune 500 list (Kroger 10k; Deloitte, 2015; Fortune). Kroger’s globally significant carbon emissions - which exceed 29 nations’ respective carbon emissions from energy - are not being adequately addressed. (Kroger, “Energy/Carbon” website; IEA, Energy Atlas). Kroger lacks climate targets, and where many companies are reducing carbon, Kroger’s 2014 Scope 1 emissions increased from the previous year. Despite its significant carbon footprint, Kroger has installed renewable energy at only 8 of its 3,806 stores, plants, and distribution centers, approximately 0.2% of its locations. (Kroger “Energy/Carbon” website, Factbook).
In contrast, Whole Foods Market offsets its entire power use with renewable energy credits, and Walmart is at 24% renewable power. (Whole Foods, “Green Mission”; Walmart, “Walmart’s Approach to Renewable Energy”). Indeed, Whole Foods Market, Walmart, Whole Foods Market, and other food companies including Coca-Cola Enterprises, Mars, Nestle, and Starbucks have committed to working towards 100% renewable energy. (RE100).
60
Investing in carbon reduction can benefit Kroger’s shareholder value. Carbon reduction activities can be lucrative, yielding returns over 30%. (“Lower emissions, higher ROI”, Carbon Disclosure Project, 2014). Research indicates that corporate management of climate impacts can lead to improved financial performance, including enhanced return on equity, stronger dividends, lower earnings volatility, and minimized regulatory risk. (“S&P 500 Leaders Report”, Carbon Disclosure Project, 2014)
According to Eric Schmidt, Executive Chairman of Google (another RE100 signatory): “Much of corporate America is buying renewable energy [...] not just to be sustainable, because it makes business sense, helping companies diversify their power supply, hedge against fuel risks, and support innovation in an increasingly cost-competitive way.” (“Google’s commitment to sustainability”, Google Green Blog, 2014).
Resolved:
Shareholders request that Kroger produce a report, by year end 2016, assessing the climate benefits and feasibility of adopting enterprise-wide, quantitative, time bound targets for increasing Kroger’s renewable energy sourcing. The report should be produced at reasonable cost and exclude proprietary information.
Supporting:Shareholders request that the report include an analysis of options and scenarios for achieving renewable energy targets, for example by using on-site distributed energy, off-site generation, power purchases, and renewable energy credits, or other opportunities management would like to consider, at its discretion.”
The Board of Directors Recommends a VoteAgainst This Proposal for the Following Reasons:
Kroger shares the proponents’ concerns regarding renewable energy sourcing. We are committed to environmental sustainability and we strive to reduce our impact on the environment by using natural resources responsibly and minimizing waste in all of our operations.
Our aggressive work in energy management resulted in a reduction of overall energy consumption in our stores saving more than 2.5 billion kWh since 2000. This is the carbon equivalent of taking 362,922 cars off the road for one year.
We are actively working to do more in both the short- and long-term. For example, our Turkey Hill Dairy has two wind energy turbines with 3.2 megawatt capacity. Since 2011, these turbines have supplied up to 25% of the dairy’s annual electricity needs, which is enough power to produce six million gallons of ice cream and 15 million gallons of iced tea. In addition, ten Kroger stores have approximately 3,092kW of solar energy capacity that in 2015 produced approximately 3.94 million kWh.
The Kroger Recovery System, located in Compton, CA at the Ralphs/Food 4 Less distribution center has been in operation since late 2012. It utilizes anaerobic digestion, a naturally occurring process, to transform food waste into renewable biogas. This system annually processes approximately 45,000 tons of food waste. This biogas is then turned into power for onsite operations. The system provided approximately 3.5 million kWh of renewable energy for the 650,000 square foot Ralphs/Food 4 Less distribution center. The system reduces area truck trips by more than 500,000 miles each year and reduces waste costs. These efforts are estimated to reduce carbon emissions by 90,000 tons per year.
For each of the past several years, we have published online our annual Sustainability Report that highlights our sustainability initiatives and waste reduction efforts in greater detail. We will continue to support efforts to increase our renewable energy sourcing as we believe these efforts are significant and meaningful. You can view our Sustainability Report atsustainability.kroger.com where we address a number of the requests made by the proponent including quantitative enterprise-wide renewable energy production metrics, and supply-chain management through our logistics initiative.
We remain committed to environmental sustainability and renewable energy sourcing and we will continue to publish reports to our shareholders tracking our initiatives. We urge you to support the furthering of our current programs and vote AGAINST this proposal.
61
Item No. 7 Shareholder Proposal – Renewable Energy
We have been notified by one shareholder, the name and shareholdings of which will be furnished promptly to any shareholder upon written or oral request to Kroger’s Secretary at our executive offices, that it intends to propose the following resolution at the annual meeting:
Shareholder ProposalShare Repurchase vs. Dividend“WHEREAS: The long term interests of shareholders are best served by companies that operate their businesses in a sustainable manner, focused on long term value creation. This is particularly important in the context of climate change. To mitigate the worst impacts of climate change, global warming must be limited to under 2 degrees Celsius (IPCC 2013), a goal consistent with the internationally recognized Paris Agreement.
“Resolved: ShareholdersKroger is one of Thethe world’s largest food retailers, exceeding $115 billion in revenue. It is listed 18th on Fortune’s Fortune 500 list and 40th on Fortune’s Global 500 list. Despite its size and significant carbon impact, Kroger Co. asklags behind its peers in establishing greenhouse gas emission reduction targets. Where most companies are reducing carbon, Kroger’s combined Scope 1 & 2 emissions have annually increased since 2013. (Kroger CDP Reports 2012-2017). Investors are concerned that Kroger’s globally significant carbon emissions are not being adequately addressed.
One meaningful way Kroger could reduce its carbon footprint is to expand its use of renewable energy. While making some inroads on energy and supply chain efficiency, Kroger has not instituted comprehensive programs to reduce the boardcarbon impact of directorsits power sourcing. Kroger’s failure to adoptmeaningfully invest in renewable energy is in strong contrast to its peers, which are rapidly and issueprofitably scaling renewable energy. Competitor Walmart installed 145 MW of solar at 364 different sites; Target developed 147 MW of solar at 300 sites, and Costco 51 MW. (https://www.seia.org/ solar-means-business-report). Walmart has further committed to 100% renewable electricity, joining other major companies such as Whole Foods Market, IKEA, and Starbucks. (http://there100.org/companies). Target recently announced new science based targets including a general payout policy that gives preference to share repurchases (relative to cash dividends) as a method to return capital to shareholders. If a general payout policy currently exists, we ask that it be amended appropriately.100% renewable energy commitment (https://cleantechnica.com/2017/10/19/target-announces-100-renewable-energy-target-
66
Supporting statement:amidst-new-climate-policy), Share repurchases aligning with existing goals to install distributed solar power on 500 more stores and distribution centers by 2020. (Target 2015 Corporate Social Responsibility Report).
According to Eric Schmidt, Executive Chairman of Alphabet Inc., “Much of corporate America is buying renewable energy [...] not just to be sustainable, because it makes business sense, helping companies diversify their power supply, hedge against fuel risks, and support innovation in an increasingly cost competitive way.” (Google Green Blog 2014).
While Kroger claims it is committed to reducing its carbon footprint, it has yet to make meaningful commitments to shift its massive energy consumption away from fossil fuel sources. Accelerating renewable energy adoption will help Kroger stay competitive and protect Kroger’s shareholder value into the future as intensifying climate change imposes growing costs on Kroger’s supply chain, physical assets, and shareholders.
RESOLVED: Shareholders request Kroger produce a method to return capital to shareholders have distinct advantages relative to dividends. Share repurchasesreport, with board oversight, assessing the climate change risk reduction benefits of adopting quantitative, time-bound, enterprise-wide targets for increasing its renewable energy sourcing. The report should be preferredproduced at reasonable cost and exclude proprietary information.
SUPPORTING STATEMENT: Shareholders request the report also include discussion of the business risk Kroger faces from climate change; the potential for the following reasons:
Some may worry that share repurchases could be usedrenewable energy procurement to prop up metrics that factor into the compensation of executives. I believe that anyreduce such concern should not interfere with the choice of optimal payout mechanism because compensation packages can be designed such that metrics are adjusted to accountrisk; and options for share repurchases.increasing renewable energy adoption.”
62
The Board of Directors Recommends a VoteAgainst This Proposal for the Following Reasons:
Kroger is committed to environmental sustainability, and we strive to reduce our impact on the environment by proactively reducing carbon emissions in our business over time. We believe the concerns of the proponent are addressed by a number of initiatives, including our 2020 Sustainability Goals and the commitments outlined in Kroger’s Zero Hunger I Zero Waste social impact plan, our vision to end hunger in the communities we call home and eliminate waste across our company by 2025.
Kroger has a history of reducing carbon emissions across our footprint through investments in energy efficiency, renewable energy and refrigerant emissions reductions. We continue to expand the implementation of existing solutions that have proven successful, as well as identify and evaluate new technologies that have the potential to further improve sustainability. As a result, we have demonstrated a long-term reduction trend in carbon emissions intensity (metric tons CO2e per square foot) across our company.
Our Commitments
In 2016, Kroger announced a set of 2020 Sustainability Goals (http://sustainability.kroger.com/2020-goals.html). We continue to make progress toward achieving these goals, which include several goals to address carbon emissions reductions. We will publish our annual Sustainability Report again this year to highlight key achievements and initiatives. More information on Kroger’s 2020 Sustainability Goals and Zero Hunger I Zero Waste can be found at www.thekrogerco.com.
The following is an overview of our key commitments and progress to date in emissions reductions:
Goal: Kroger will reduce cumulative electricity consumption in our stores by 40% by 2020, using 2000 as a baseline year.
Kroger has shown long-term success in reducing energy consumption through the maintenance of existing processes and technologies as well as testing and learning from new technologies. In 2017, we installed new LED lighting in more than 1,500 stores, and we will continue to retrofit remaining stores in 2018. We also participate in the U.S. EPA’s ENERGY STAR program and have more than
67
790 ENERGY STAR certified Kroger-operated stores to date. We continue to pursue additional ENERGY STAR certifications on an ongoing basis. In fact, we recently earned the 2018 ENERGY STAR Partner of the Year award. As a result of these efforts, we made significant progress on our goal in 2017.
Goal: Kroger will improve transportation efficiency by 20% by 2020, using 2010 as a baseline year.
Our Logistics team continues to track our Ton Miles Per Gallon (TMPG), which effectively looks at how many miles we haul one ton of groceries on one gallon of fuel. By the end of 2017, we had achieved an improvement of 8.1% due to ongoing evaluation of new technologies and increasing efficiencies in how we make deliveries and operate our equipment. In addition, Kroger has committed to adding Tesla Semi electric trucks to its distribution fleet, which require lower energy cost per mile in comparison to conventional diesel tractors.
Goal: Kroger will reduce refrigerant leaks in our supermarket refrigeration systems by 10% annually.
Kroger continues to reduce refrigerant leaks in our stores and sets annual reduction targets through the EPA’s GreenChill Program. In 2017, we achieved our goal to further reduce refrigerant emissions by 10% in our stores as a result of installing refrigerant leak protection systems and an active leak detection program. We are committed to an additional 9% reduction in 2018.
Goal: Kroger will be a Zero Waste Company by 2020 (90% or more of waste diverted away from landfills) and eliminate food waste across our company by 2025.
Kroger previously committed to achieve Zero Waste across our company as part of our 2020 Sustainability Goals. Our current landfill diversion rate is greater than 75%, thanks to our Manufacturing and Logistics teams – both above 90% diversion – and the success of our Zero Hunger I Zero Waste Food Rescue Program. As part of Kroger’s commitment to Zero Hunger I Zero Waste, we set a new industry-leading goal to eliminate food waste across our company by 2025. As a food manufacturer and retailer, the reduction of food waste is an important component of our scope 3 emissions – key to reducing the production of methane, one of the most potent greenhouse gases. We are working with the World Wildlife Fund to assess our food waste impacts, set goals to reduce waste and establish a framework for food waste reporting going forward.
Innovative Approaches
Kroger continues to evaluate and launch solar power installations at our facilities. In 2017, we activated new solar power parking lot installations at three Fry’s supermarket locations. These combined solar power and shade technology projects generate renewable power for our stores as well as cover for our customers’ cars while they shop with us. Collectively, our solar and wind power installations generated more than 14.5 million kWh of power this past year.
In late 2017, Kroger completed installation and activated a new anaerobic wastewater treatment facility at our KB Specialty Foods food production plant in Greensburg, Indiana. This anaerobic digestion process converts the wastewater into renewable biogas, which is used to produce electricity. When running at maximum capacity, the digester can produce up to 30% of the electricity needed to operate the KB Specialty Foods plant. This is Kroger’s second anaerobic digester. The first is the Kroger Recovery System, an anaerobic digester at the Ralphs/Food 4 Less Distribution Center in Compton, California. This facility began operations in late 2012 and is designed to process inedible food and other organic waste into renewable biogas, and ultimately electricity. As with the Greensburg facility, the Compton digester can supply a portion of the distribution center’s power needs.
Looking Ahead
Finally, as part of our ongoing commitment to environmental sustainability, we continue to evaluate the next steps in our carbon reduction strategy. We continue to engage internal and external
68
stakeholders in this discussion, as well as benchmark other companies with leading carbon reduction targets and initiatives. While we remain focused on achieving our 2020 and 2025 goals, we are also reviewing the means and opportunities for further carbon emission reductions in the future.
The proposal asks that Kroger issue a report on renewable energy. Kroger publishes details on our sustainability goals, initiatives, and progress against our targets in our Sustainability Report and on our website (sustainability.kroger.com). Given our extensive reporting and our strong focus on ensuring we are responsible stewards of the environment, the Board believes that issuing a report on renewable energy would be unnecessary and would consume time and resources that are best spent on executing on our sustainability programs and targets.
We urge you to support the furthering of our current programs and vote AGAINST this proposal.
Item No. 8 Shareholder Proposal – Independent Chairman
We have been notified by one shareholder, the name and shareholdings of which will be furnished promptly to any shareholder upon written or oral request to Kroger’s Secretary at our executive offices, that it intends to propose the following resolution at the annual meeting:
“RESOLVED: Shareowners of The Kroger Co. (“Kroger”) ask the Board of Directors to adopt a policy, and amend the bylaws as necessary, to require the Chair of the Board to be an independent member of the Board. This policy shall apply prospectively so as not to violate any contractual obligation. The policy should provide that (i) if the Board determines that a Chair who was independent when selected is no longer independent, the Board shall select a new Chair who satisfies the policy within 60 days of that determination; and (ii) compliance with this policy is waived if no independent director is available and willing to serve as Chair.
SUPPORTING STATEMENT:
Except for brief “apprenticeship” periods at the outset of their CEO service, Kroger CEOs have also held the role of Board Chair for many decades. We believe the combination of these two roles in a single person weakens a corporation’s governance, which can harm shareholder value. As Intel’s former Chair Andrew Grove stated, “The separation of the two jobs goes to the heart of the conception of a corporation. Is a company a sandbox for the CEO, or is the CEO an employee? If he’s an employee, he needs a boss, and that boss is the board. The chairman runs the board. How can the CEO be his own boss?”
In our view, shareholder value is enhanced by an independent Board Chair who can provide a balance of power between the CEO and the Board and support strong Board oversight.
Proxy advisor Glass Lewis opined in a 2016 report that “shareholders are better served when the board is led by an independent Chairman who we believe is better able to oversee the executives of the Company and set apro-shareholder agenda without the management conflicts that exist when a CEO or other executive also serves as Chairman.”(www.glasslewis.com/wp-content/uploads/2016/03/2016-In-Depth-Report-INDEPENDENT-BOARD-CHAIRMAN.pdf)
An independent Board Chair has been found in academic studies to improve the performance of public companies, although evidence overall is inconclusive. While separating the roles of Chair and CEO is the norm in Europe, 48% of S&P 500 company boards have also implemented this best practice.(www.spencerstuart.comt-/media/pdr/020files/research%20and%20insight%20pdfs/spencer-stuart-us-board-index-2016.pdf)
We believe that independent Board leadership would be particularly useful at Kroger in providing more robust oversight regarding sustainability issues. We agree with the recent observations by State Street Global Advisors’ CEO that “a long-term horizon requires a focus on sustainability” and that boards “are often better-equipped than theday-to-day management to see these issues over longer
69
time horizons.”(www.ssga.com/investment-topics/environmental-social-governance/2017/long-term-value-begins-at-the-board-eu.pdf)
Kroger continues to risk its reputation by selling produce treated with neonicotinoids, a group of insecticides highly toxic to bees. Kroger has refused to join the Fair Food Program to ensure equitable treatment of farm workers. Kroger also faces reputational risk associated with its responses to the impacts of food production on deforestation. Independent Board leadership would, we think, more likely result in improved policies and practices to mitigate these business risks.
We urge shareholders to vote for this proposal.”
The Board of Directors Recommends a VoteAgainst This Proposal for the Following Reasons:
The Board should have the flexibility to determine the Board’s structure tailored to Kroger’s needs at any time, including separating or combining the roles of Chairman and CEO.
Kroger’s Board is structured to provide the most effective leadership for our shareholders. Our shareholders’ interests are best served when the company retains the flexibility to select the appropriate person to serve in the Chairman’s role given the changing circumstances of the retail food marketplace. The Board believes that the policy advocated by the shareholderproponent’s rigid “one size fits all” proposal is not in the best interest of shareholders and should be rejected. Kroger has a balanced governance structure in which independent directors, including an independent Lead Director, exercise meaningful and vigorous oversight. Kroger’s Board is led by a strong independent Lead Director who serves the same functions as a Chairman and provides the safeguards that the proposal seeks.
Kroger’s independent Lead Director has robust responsibilities that ensure a strong, independent and active board that complements the Chairman’s role.
The Lead Director’s robust duties and responsibilities are addressed in detail in the Guidelines which are available at ir.kroger.com. The Lead Director serves a variety of roles, including:
While our current Chairman is also the CEO, this structure is a reflection of the Board’s current view that both Kroger and our shareholders would not be best served by separation the roles at this time given the important skills and industry expertise that our CEO brings to the Board, particularly given Kroger’s current transformation under theRestock Kroger plan. However, the Board routinely reviews Kroger’s leadership structure which includes a discussion of Kroger’s performance, the impact that the leadership has on that performance, and the structure that best serves the interests of shareholders.
Our strong governance practices ensure our shareholdersBoard’s independent leadership and oversight. The Board has instituted structures and practices, in addition to the independent Lead Director, that create a balanced governance system of independent and effective oversight, including:
70
Contrary to the assertions in the allocationproponent’s supporting statement, there is no established consensus that separating the roles of capital.the Chairman and the CEO is a best practice or that such a separation enhances returns for shareholders. The authors of a 2004 Wharton School of Business article entitled “Splitting Up the Roles of CEO and Chairman: Reform or Red Herring?” (http://knowledge.wharton.upenn.edu/article.cfm?articleid=987) concluded that there is no evidence that separating the positions of Chairman and CEO improves corporate performance. In “Corporate Governance Update: Analyzing Aspects of Board Composition,” David A Katz and Laura A. McIntosh, New York Law Journal, January 26, 2012, the authors concluded that from a rapidly evolving capital market, this flexibilityboard effectiveness perspective, there is no need to separate the roles of Chairman and CEO so long as there is an essential elementeffective lead director in place. In addition, the careful managementmajority of shareholder capital, whichU.S. companies have not implemented the structure recommended by the proposal.
The Board thoughtfully overseeswill continue to review Kroger’s leadership structure to ensure that the structure best addresses Kroger’s evolving and reviews on a regular basis.
Our long-term financial strategy continues to be to use cash flow from operations,dynamic business in a balanced manner, to repurchase shares, fund dividends,consultation with the current Board and increase capital investments, all while maintaining our current investment grade debt rating. Our balanced approach gives usshareholders. The Board believes that eliminating the flexibility to pursue long-term growth strategies while returning capital todetermine which type of leadership structure is not in our shareholders.shareholders’ best interests.
Kroger is proud of our strong history of capital return to shareholders. We have made significant commitments over time to return capital to shareholders both through repurchases of our common shares and payment of cash dividends. We repurchased $703 million of Kroger common shares in 2015, as well as $1.1 billion in 2014, $338 million in 2013 and $1.2 billion in 2012. Additionally,For the foregoing reasons, we paid dividends totaling $385 million in 2015, $338 million in 2014, $319 million in 2013 and $267 million in 2012. We are also committed to growing long-term shareholder value through significant capital investments. Excluding acquisitions, we invested $3.38 billion, $2.89 billion, $2.46 billion and $2.06 billion in capital projects in 2015, 2014, 2013, and 2012, respectively. Many of our shareholders view both dividends and share repurchases as an important component of Kroger’s investment profile, especially in light of our balanced capital return strategy that contributes to a healthy TSR (total shareholder return), which outperforms both our peers and the S&P 500 over time.
When contemplating capital returns, the Board engages in a thorough analysis and oversight process. Before the Board approves any share repurchase program or declares a cash dividend, it takes into account a wide range of factors, including Kroger’s short and long-term growth strategies, liquidity needs and capital requirements, cash flows, net earnings, debt obligations, and leverage ratios. The Board also considers how the then-current capital market conditions affect Kroger’s policies and strategies. There is no one-size-fits-all policy or strategy in returning capital to shareholders that would satisfy each market condition over the course of time. Balanced capital allocation decisions, overseen by an effective Board, remain the most effective and flexible strategy to continuously deliver healthy value to shareholders over the long-term.
This proposal requests that Kroger adopt a general policy that gives preference to share repurchases relative to cash dividends. We urge you to voteAGAINST this proposal.
63
Shareholder Proposals and Director Nominations – 20172019 Annual Meeting
ShareholderPursuant to Rule14a-8 under the Securities Exchange Act of 1934, as amended, shareholder proposals intended for inclusion in the proxy material relating to Kroger’s annual meeting of shareholders in June 20172019 should be addressed to Kroger’s Secretary and must be received at our executive offices not later than January 12, 2017., 2019. These proposals must comply with Rule14a-8 and the SEC’s proxy rules. If a shareholder submits a proposal outside of Rule14a-8 for the 2019 annual meeting and such proposal is not delivered within the time frame specified in the Regulations, Kroger’s proxy may confer discretionary authority on persons being appointed as proxies on behalf of Kroger to vote on such proposal.
In addition, Kroger’s Regulations contain an advance notice of shareholder business and director nominations requirement, which generally prescribes the procedures that a shareholder of Kroger must follow if the shareholder intends, at an annual meeting, to nominate a person for election to Kroger’s Board of Directors or to propose other business to be considered by shareholders. These procedures include, among other things, that the shareholder give timely notice to Kroger’s Secretary of the nomination or other proposed business, that the notice contain specified information, and that the shareholder comply with certain other requirements. In order to be timely, this notice must be delivered in writing to Kroger’s Secretary, at our principal executive offices, not later 45 calendar days prior to the date on which our proxy statement for the prior year’s annual meeting of shareholders was mailed to shareholders. If a shareholder’s nomination or proposal is not in compliance with the procedures set forth in the Regulations, we may disregard such nomination or proposal. Accordingly, if a shareholder intends, at the 20172019 annual meeting, to nominate a person for election to the Board of Directors or to propose other business, the shareholder must deliver a notice of such nomination or proposal to Kroger’s Secretary not later than March 28, 2017,, 2019 and comply with the requirements of the Regulations. If a shareholder submits a proposal outside of Rule 14a-8Item No. 3 on proxy access is approved by the requisite vote at the 2018 Annual Meeting, eligible shareholders will have the ability to submit director nominees for inclusion in our proxy statement for the 20172019 annual meeting of shareholders. As described in more detail in Item No. 3, to be eligible, shareholders must have owned at least 3% of our common shares for at least three years. Up to 20
71
shareholders will be able to aggregate for this purpose. Nominations must be submitted to our Corporate Secretary at our principal executive offices no earlier than December , 2018 and such proposal is not delivered within the time frame specified in the Regulations, Kroger’s proxy may confer discretionary authority on persons being appointed as proxies on behalf of Kroger to vote on such proposal. no later than January , 2019.
Shareholder proposals, director nominations, including, if applicable pursuant to proxy access, and advance notices should be addressed in writing to: Corporate Secretary, The Kroger Co., 1014 Vine Street, Cincinnati, Ohio 45202-1100.
20152017 Annual Report
Attached to this Proxy Statement is our 20152017 Annual Report which includes a brief description of our business, including the general scope and nature thereof during fiscal year 2015,2017, together with the audited financial information contained in our 20152017 Annual Report on Form10-K filed with the SEC.A copy of that report is available to shareholders on request without charge by writing to: Todd A. Foley,Carin Fike, Treasurer, The Kroger Co., 1014 Vine Street, Cincinnati, Ohio 45202-110045202 or by calling 513-762-1220513-762-1220.. Our SEC filings are available to the public on the SEC’s website at www.sec.gov.
Householding of Proxy Materials
We have adopted a procedure approved by the SEC called “householding.” Under this procedure, shareholders of record who have the same address and last name will receive only one copy of the Notice of Availability of Proxy Materials (or proxy materials in the case of shareholders who receive paper copies of such materials) unless one or more of these shareholders notifies us that they wish to continue receiving individual copies. This procedure will reduce our printing costs and postage fees. Householding will not in any way affect dividend check mailings.
If you are eligible for householding, but you and other shareholders of record with whom you share an address currently receive multiple copies of our Notice of Availability of Proxy Materials (or proxy materials in the case of shareholders who receive paper copies of such materials), or if you hold in more than one account, and in either case you wish to receive only a single copy for your household or if you prefer to receive separate copies of our documents in the future, please contact your bank or broker, or contact Kroger’s Secretary at 1014 Vine Street, Cincinnati, Ohio 45202-110045202 or via telephone at513-762-4000.
Beneficial shareholders can request information about householding from their banks, brokers or other holders of record.
The management knows of no other matters that are to be presented at the meeting, but, if any should be presented, the Proxy Committee expects to vote thereon according to its best judgment.
By order of the Board of Directors, |
64
_____________2015 ANNUAL REPORT_____________Christine S. Wheatley, Secretary
72
Appendix A
Proposed Proxy Access Provision
FINANCIAL REPORT 2015
MANAGEMENT’S RESPONSIBILITY FOR FINANCIAL REPORTING
The management(3) (a) Subject to the requirements of The Kroger Co. hasthis Section 2, the responsibilityCompany shall include in its proxy statement and on its proxy card for preparingany annual meeting of shareholders the accompanying financial statementsname of any director nominee proposed by a shareholder for election to the Board of directors who is properly submitted pursuant to this Section 2(B)(3) (each a “Proxy Access Nominee”) provided that (i) timely written notice of such Proxy Access Nominee satisfying this Section 2(B)(3) (“Proxy Access Nomination Notice”) is delivered to the Company by or on behalf of a shareholder or group of shareholders that, at the time the Proxy Access Nomination Notice is delivered, satisfy the ownership and for their integrityother requirements of this Section 2(B)(3) (such shareholder or shareholders, and objectivity. The statements were preparedany person on whose behalf they are acting, the “Eligible Shareholder”), (ii) the Eligible Shareholder expressly elects in accordance with generally accepted accounting principles applied on a consistent basis and are not misstated duewriting at the time of providing the Proxy Access Nomination Notice to material error or fraud. The financial statements include amounts that are based on management’s best estimates and judgments. Management also prepared the other informationhave its nominee included in the reportCompany’s proxy statement pursuant to this Section 2(B)(3), and is responsible(iii) the Eligible Shareholder and the Proxy Access Nominee otherwise satisfy the requirements of this Section 2(B)(3) and the criteria for its accuracy and consistency withBoard membership set forth in the financial statements.Board of directors’ Guidelines on Issues of Corporate Governance or other document(s) setting forth qualifications for directors (the “Board Qualifications”).
Kroger’s financial statements have been audited by PricewaterhouseCoopers LLP, an independent registered public accounting firm, whose selection has been ratified by(b) To be timely, the shareholders. Management has made availableEligible Shareholder must deliver to PricewaterhouseCoopers LLP all of Kroger’s financial records and related data, as well as the minutessecretary of the shareholders’ and directors’ meetings. Furthermore, management believes that all representations made to PricewaterhouseCoopers LLP during its audit were valid and appropriate.
Management also recognizes its responsibility for fostering a strong ethical climate so that Kroger’s affairs are conducted according toCompany at the highest standards of personal and corporate conduct. This responsibility is characterized and reflected inThe Kroger Co. Policy on Business Ethics, which is publicized throughout Kroger and available on Kroger’s website at ir.kroger.com.The Kroger Co. Policy on Business Ethics addresses, among other things, the necessity of ensuring open communication within Kroger; potential conflicts of interests; compliance with all domestic and foreign laws, including those related to financial disclosure; and the confidentiality of proprietary information. Kroger maintains a systematic program to assess compliance with these policies.
MANAGEMENT’S REPORT ON INTERNAL CONTROL OVER FINANCIAL REPORTING
Management is responsible for establishing and maintaining adequate internal control over financial reporting for the Company. With the participationprincipal office of the Chief Executive Officer andCompany the Chief Financial Officer, our management conducted an evaluation of the effectiveness of our internal control over financial reporting based on the framework and criteria established inInternal Control – Integrated Framework (2013), issued by the Committee of Sponsoring Organizations of the Treadway Commission. Our management excluded Roundy’s, Inc. from its assessment of internal control over financial reporting because it was acquired in a purchase business combination on December 18, 2015. Roundy’s, Inc. is a wholly-owned subsidiary whose total assets and total revenues represent 2% and lessProxy Access Nomination Notice not later than 1%, respectively, of the related consolidated financial statement amounts as of and for the year ended January 30, 2016. Based on this evaluation, management has concluded that the Company’s internal control over financial reporting was effective as of January 30, 2016.
A-1
SELECTED FINANCIAL DATA
| Fiscal Years Ended | |||||||||||||||||||||||||
January 30, | January 31, | February 1, 2014 (52 weeks)(1) | February 2, 2013 (53 weeks) | January 28, 2012 (52 weeks) | |||||||||||||||||||||
| (In millions, except per share amounts) | |||||||||||||||||||||||||
| Sales | $ | 109,830 | $ | 108,465 | $ | 98,375 | $ | 96,619 | $ | 90,269 | |||||||||||||||
| Net earnings including | |||||||||||||||||||||||||
| noncontrolling interests | 2,049 | 1,747 | 1,531 | 1,508 | 596 | ||||||||||||||||||||
| Net earnings attributable to | |||||||||||||||||||||||||
| The Kroger Co. | 2,039 | 1,728 | 1,519 | 1,497 | 602 | ||||||||||||||||||||
| Net earnings attributable to | |||||||||||||||||||||||||
| The Kroger Co. per diluted | |||||||||||||||||||||||||
| common share | 2.06 | 1.72 | 1.45 | 1.39 | 0.51 | ||||||||||||||||||||
| Total assets | 33,897 | 30,497 | 29,281 | 24,634 | 23,454 | ||||||||||||||||||||
| Long-term liabilities, including | |||||||||||||||||||||||||
| obligations under capital leases | |||||||||||||||||||||||||
| and financing obligations | 14,123 | 13,663 | 13,181 | 9,359 | 10,405 | ||||||||||||||||||||
| Total shareholders’ equity – | |||||||||||||||||||||||||
| The Kroger Co. | 6,811 | 5,412 | 5,384 | 4,207 | 3,981 | ||||||||||||||||||||
| Cash dividends per common share | 0.395 | 0.340 | 0.308 | 0.248 | 0.215 | ||||||||||||||||||||
COMMON SHARE PRICE RANGE
| 2015 | 2014 | |||||||||||
| Quarter | High | Low | High | Low | ||||||||
| 1st | $ | 38.87 | $ | 34.05 | $ | 23.95 | $ | 17.57 | ||||
| 2nd | $ | 38.65 | $ | 37.09 | $ | 25.75 | $ | 23.25 | ||||
| 3rd | $ | 38.73 | $ | 27.32 | $ | 29.08 | $ | 24.99 | ||||
| 4th | $ | 42.75 | $ | 36.00 | $ | 35.03 | $ | 28.64 | ||||
Main trading market: New York Stock Exchange (Symbol KR) Number of shareholders of record at fiscal year-end 2015: 29,102 Number of shareholders of record at March 23, 2016: 28,959 | ||||||||||||
During 2015, we paid two quarterly cash dividends of $0.0925 per share and two quarterly cash dividends of $0.105 per share. During 2014, we paid three quarterly cash dividends of $0.0825 per share and one quarterly cash dividend of $0.0925 per share. On March 1, 2016, we paid a quarterly cash dividend of $0.105 per share. On March 10, 2016, we announced that our Board of Directors have declared a quarterly cash dividend of $0.105 per share, payable on June 1, 2016, to shareholders of record at the close of business on May 13, 2016. We currently expectthe 120th calendar day nor earlier than the close of business on the 150th calendar day prior to continuethe date on which the Company’s proxy statement for the prior year’s annual meeting of shareholders was first mailed to pay comparable cash dividendsshareholders provided, however, that in the event that the date of the annual meeting is more than 30 days before or more than 60 days after the anniversary date of the preceding year’s annual meeting, to be timely, notice by the shareholder must be delivered by the 10th day following the day on which a quarterly basis dependingpublic announcement of the subject meeting is first made by the Company. In no event shall the public announcement of an adjournment or postponement of an annual meeting of shareholders commence a new time period (or extend any time period) for the submission of such Proxy Access Nomination.
(c) In addition to including the name of the Proxy Access Nominee in the Company’s proxy statement for the annual meeting of shareholders, the Company also shall include (i) the information concerning the Proxy Access Nominee and the Eligible Shareholder that is required to be disclosed in the Company’s proxy statement pursuant to the proxy rules of the Securities and Exchange Commission (the “SEC”) and (ii) a Statement (defined below) (collectively, the “Required Information”). To be timely, the Required Information must be received by the secretary of the Company at the principal office of the Company within the time period specified in Section 2(B)(3)(b). Nothing in this Section 2(B)(3) shall limit the Company’s ability to solicit against and include in its proxy statement its own statements relating to any Proxy Access Nominee.
(d) The number of Proxy Access Nominees (including Proxy Access Nominees who were (i) submitted by an Eligible Shareholder for inclusion in the Company’s proxy statement pursuant to this Section 2(B)(3) that the Board of directors decides to nominate or (ii) previously elected based upon a nomination pursuant to this Section 2(B)(3) at any of the preceding two annual meetings and are being recommended for reelection by the Board of directors at the upcoming annual meeting) shall not exceed the greater of two or twenty percent of the number of directors in office as of the last day on our earningswhich notice of a nomination may be delivered pursuant to this Section 2(B)(3) (the “Final Proxy Access Nomination Date”) or, if such amount is not a whole number, the closest whole number below twenty percent (the “Permitted Number”); provided, however, that the Permitted Number shall be reduced (but not below one) by the number of director nominees for which the Company received one or more valid notices that a shareholder intends to nominate a person or persons for election to the Board of directors at an annual meeting of shareholders pursuant to Section 2B(2). In the event that,
73
for any reason, one or more vacancies on the Board of directors occurs at any time after the Final Proxy Access Nomination Date and other factors.
A-2
PERFORMANCE GRAPH
Set forth below is a line graph comparingbefore the five-year cumulative total shareholder return on our common shares,date of the annual meeting of shareholders and the Board of directors resolves to reduce the size of the Board of directors in connection therewith, the Permitted Number shall be calculated based on the market pricenumber of directors in office as so reduced. In the event that the number of Proxy Access Nominees submitted by Eligible Shareholders pursuant to this Section 2(B)(3) exceeds the Permitted Number, each Eligible Shareholder shall select one Proxy Access Nominee for inclusion in the Company’s proxy statement until the Permitted Number is reached, going in order of the amount (greatest to least) of voting power of the shares of the Company entitled to vote on the election of directors as disclosed in the Notice. If the Permitted Number is not reached after each Eligible Shareholder has selected one Proxy Access Nominee, this selection process shall continue as many times as necessary, following the same order each time, until the Permitted Number is reached.
(e) An Eligible Shareholder must have owned (as defined below) continuously for at least three years a number of shares that represents three percent or more of the total voting power of the Company’s outstanding shares entitled to vote in the election of directors as of the most recent date prior to the submission of the Proxy Access Nomination Notice for which such amount is given in any filing by the Company with the SEC (the “Required Shares”) as of both the date the Proxy Access Nomination Notice is received by the Company in accordance with this Section 2(B)(3) and the record date for determining shareholders entitled to vote at the annual meeting of shareholders and must continue to own the Required Shares through the meeting date. For purposes of satisfying the ownership requirement under this Section 2(B)(3), the voting power represented by the shares of the Company owned by one or more shareholders, or by the person or persons who own shares of the Company and on whose behalf any shareholder is acting, may be aggregated, provided that the number of shareholders and other persons whose ownership of shares is aggregated for such purpose shall not exceed twenty, and a group of two or more funds that are (i) under common management and investment control, (ii) under common management and funded primarily by the same employer (or by a group of related employers that are under common control), or (iii) a “group of investment companies,” as such term is defined in Section 12(d)(1)(G)(ii) of the Investment Company Act of 1940, as amended, shall be treated as one shareholder or person for this purpose. With respect to any annual meeting of shareholders, no person may be a member of more than one group of persons constituting an Eligible Shareholder under this Section 2(B)(3).
(f) For purposes of this Section 2(B)(3), an Eligible Shareholder shall be deemed to “own” only those outstanding shares of the Company as to which the person possesses both (i) the full voting and investment rights pertaining to the shares and assuming reinvestment(ii) the full economic interest in (including the opportunity for profit and risk of dividends,loss on) such shares; provided that the number of shares calculated in accordance with clauses (i) and (ii) shall not include any shares (1) sold by such person or any of its affiliates in any transaction that has not been settled or closed, (2) borrowed by such person or any of its affiliates for any purposes or purchased by such person or any of its affiliates pursuant to an agreement to resell, or (3) subject to any option, warrant, forward contract, swap, contract of sale, other derivative or similar agreement entered into by such person or any of its affiliates, whether any such instrument or agreement is to be settled with shares or with cash based on the cumulative total returnnotional amount or value of companiesthe Company’s outstanding shares, in any such case which instrument or agreement has, or is intended to have, the purpose or effect of reducing in any manner, to any extent or at any time in the Standard & Poor’s 500 Stock Indexfuture, such person’s or affiliates’ full right to vote or direct the voting of any such shares and/or hedging, offsetting or altering to any degree gain or loss arising from the full economic ownership of such shares by such person or affiliate. A person shall “own” shares held in the name of a nominee or other intermediary so long as the person retains the right to instruct how the shares are voted with respect to the election of directors and a peer group composedpossesses the full economic interest in the shares. A person’s ownership of food and drug companies.
COMPARISON OF CUMULATIVE FIVE-YEAR TOTAL RETURN*Among The Kroger Co., the S&P 500, and Peer Group**
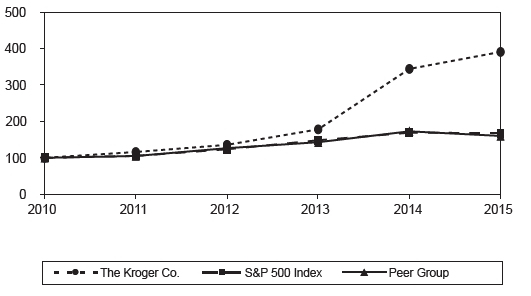
| Base | INDEXED RETURNS | |||||||||||
| Period | Years Ending | |||||||||||
| Company Name/Index | 2010 | 2011 | 2012 | 2013 | 2014 | 2015 | ||||||
| The Kroger Co. | 100 | 116.26 | 136.28 | 179.49 | 348.32 | 395.78 | ||||||
| S&P 500 Index | 100 | 105.33 | 123.87 | 149.02 | 170.22 | 169.08 | ||||||
| Peer Group | 100 | 105.11 | 126.94 | 143.63 | 173.96 | 161.13 | ||||||
The foregoing Performance Graph will notshares shall be deemed incorporated by reference intoto continue during any other filing, absent an express reference thereto.
A-3
ISSUER PURCHASESOF EQUITY SECURITIES
| Period(1) | Total Number of Shares Purchased(2) | Average Price Paid Per Share | Total Number of Shares Purchased as Part of Publicly Announced Plans or Programs(3) | Maximum Dollar Value of Shares that May Yet Be Purchased Under the Plans or Programs(4) (in millions) | |||||||||||
| First period - four weeks | |||||||||||||||
| November 8, 2015 to December 5, 2015 | 94,717 | $ | 37.89 | 74,819 | $500 | ||||||||||
| Second period - four weeks | |||||||||||||||
| December 6, 2015 to January 2, 2016 | 906,648 | $ | 41.47 | 831,783 | $500 | ||||||||||
| Third period – four weeks | |||||||||||||||
| January 3, 2016 to January 30, 2016 | 213,721 | $ | 39.73 | 169,598 | $500 | ||||||||||
| Total | 1,215,086 | $ | 40.88 | 1,076,200 | $500 | ||||||||||
BUSINESS
The Kroger Co. (the “Company” or “Kroger”) was founded in 1883 and incorporated in 1902. As of January 30, 2016, we are one of the largest retailers in the world based on annual sales. We also manufacture and process some of the food for sale in our supermarkets. Our principal executive offices are located at 1014 Vine Street, Cincinnati, Ohio 45202, and our telephone number is (513) 762-4000. We maintain a web site (www.thekrogerco.com) that includes additional information about the Company. We make available through our web site, free of charge, our annual reports on Form 10-K, our quarterly reports on Form 10-Q, our current reports on Form 8-K and our interactive data files, including amendments. These forms are available as soon as reasonably practicable after we have filed them with, or furnished them electronically to, the SEC.
A-4
Our revenues are predominately earned and cash is generated as consumer products are sold to customers in our stores and fuel centers. We earn income predominantly by selling products at price levels that produce revenues in excess of the costs to make these products available to our customers. Such costs include procurement and distribution costs, facility occupancy and operational costs, and overhead expenses. Our fiscal year ends on the Saturday closest to January 31. All references to 2015, 2014 and 2013 are to the fiscal years ended January 30, 2016, January 31, 2015 and February 1, 2014, respectively, unless specifically indicated otherwise.
EMPLOYEES
As of January 30, 2016, Kroger employed approximately 431,000 full- and part-time employees. A majority of our employees are covered by collective bargaining agreements negotiated with local unions affiliated with one of several different international unions. There are approximately 350 such agreements, usually with terms of three to five years.
STORES
As of January 30, 2016, Kroger operated, either directly or through its subsidiaries, 2,778 retail food stores under a variety of local banner names, 1,387 of which had fuel centers. Approximately 42% of these supermarkets were operated in Company-owned facilities, including some Company-owned buildings on leased land. Our current strategy emphasizes self-development and ownership of store real estate. Our stores operate under a variety of banners that have strong local ties and brand recognition. Supermarkets are generally operated under one of the following formats: combination food and drug stores (“combo stores”); multi-department stores; marketplace stores; or price impact warehouses.
The combo store is the primary food store format. They typically draw customers from a 2 – 2½ mile radius. We believe this format is successful because the stores are large enough to offer the specialty departments that customers’ desire for one-stop shopping, including natural food and organic sections, pharmacies, general merchandise, pet centers and high-quality perishables such as fresh seafood and organic produce.
Multi-department stores are significantly larger in size than combo stores. In addition to the departments offered at a typical combo store, multi-department stores sell a wide selection of general merchandise items such as apparel, home fashion and furnishings, outdoor living, electronics, automotive products, toys and fine jewelry.
Marketplace stores are smaller in size than multi-department stores. They offer full-service grocery, pharmacy and health and beauty care departments as well as an expanded perishable offering and general merchandise area that includes apparel, home goods and toys.
Price impact warehouse stores offer a “no-frills, low cost” warehouse format and feature everyday low prices plus promotions for a wide selection of grocery and health and beauty care items. Quality meat, dairy, baked goods and fresh produce items provide a competitive advantage. The average size of a price impact warehouse store is similar to that of a combo store.
In addition to the supermarkets, as of January 30, 2016, we operated, through subsidiaries, 784 convenience stores, 323 fine jewelry stores and an online retailer. All 121 of our fine jewelry stores located in malls are operated in leased locations. In addition, 78 convenience stores were operated by franchisees through franchise agreements. Approximately 54% of the convenience stores operated by subsidiaries were operated in Company-owned facilities. The convenience stores offer a limited assortment of staple food items and general merchandise and, in most cases, sell gasoline.
SEGMENTS
We operate retail food and drug stores, multi-department stores, jewelry stores, and convenience stores throughout the United States. Our retail operations, which represent over 99% of our consolidated sales and earnings before interest, taxes and depreciation and amortization (“EBITDA”), is our only reportable segment. Our retail operating divisions have been aggregated into one reportable segment due to the operating divisions having similar economic characteristics with similar long-term financial performance. In addition, our operating divisions offer customers similar products, have
A-5
similar distribution methods, operate in similar regulatory environments, purchase the majority of the merchandise for retail sale from similar (and in many cases identical) vendors on a coordinated basis from a centralized location, serve similar types of customers, and are allocated capital from a centralized location. Our operating divisions reflect the mannerperiod in which the business is managed and how our Chief Executive Officer, who acts as our chief operating decision maker, assesses performance internally. All of our operations are domestic. Revenues, profits and losses and total assets are shown in our Consolidated Financial Statements set forth beginning on page A-29 below.
MERCHANDISING AND MANUFACTURING
Corporate brand products play an important role in our merchandising strategy. Our supermarkets, on average, stock over 14,000 private label items. Our corporate brand products are primarily produced and sold in three “tiers.” Private Selection® is the premium quality brand designed to be a unique item in a category or to meet or beat the “gourmet” or “upscale” brands. The “banner brand” (Kroger®, Ralphs®, Fred Meyer®, King Soopers®, etc.), which represents the majority of our private label items, is designed to satisfy customers with quality products. Before we will carry a “banner brand” product we must be satisfiedperson has loaned such shares, provided that the product quality meets our customers’ expectationsperson has the power to recall such loaned shares on five business days’ notice and provides a
74
representation that it will promptly recall such loaned shares upon being notified that any of its Proxy Access Nominees will be included in tastethe Company’s proxy statement, or the person has delegated any voting power by means of a proxy, power of attorney or other instrument or arrangement that is revocable at any time by the person. The terms “owned,” “owning,” and efficacy, and we guarantee it. P$$T…®, Check This Out… and Heritage Farm™ are the three value brands, designed to deliver good quality at a very affordable price. In addition, we continue to grow our other brands, including Simple Truth® and Simple Truth Organic®. Both Simple Truth and Simple Truth Organic are Free From 101 artificial preservatives and ingredients that customers have told us they do not want in their food, and the Simple Truth Organic products are USDA certified organic.
Approximately 40%variations of the corporate brand units sold in our supermarkets are produced in our food production plants;word “own” shall have correlative meanings. For purposes of this Section 2(B)(3), the remaining corporate brand items are produced to our strict specifications by outside manufacturers. We perform a “make or buy” analysis on corporate brand products and decisions are based upon a comparison of market-based transfer prices versus open market purchases. As of January 30, 2016, we operated 38 food production plants. These plants consisted of 17 dairies, ten deli or bakery plants, five grocery product plants, two beverage plants, two meat plants and two cheese plants.
SEASONALITY
The majority of our revenues are generally not seasonal in nature. However, revenues tend to be higher duringterm “affiliate” shall have the major holidays throughout the year.
EXECUTIVE OFFICERS OF THE REGISTRANT
The disclosure regarding executive officers is set forth in Item 10 of the Company’s Annual Report on Form 10-K for fiscal year 2015 under the heading “Executive Officers of the Company,” and is incorporated herein by reference.
COMPETITIVE ENVIRONMENT
For the disclosure related to our competitive environment, see Item 1A of the Company’s Annual Report on Form 10-K for fiscal year 2015 under the heading “Competitive Environment.”
A-6
Management’s Discussion and Analysis ofFinancial Condition and Results of Operations
OUR BUSINESS
The Kroger Co. was founded in 1883 and incorporated in 1902. Kroger is one of the nation’s largest retailers, as measured by revenue, operating 2,778 supermarket and multi-department stores under a variety of local banner names in 35 states and the District of Columbia. Of these stores, 1,387 have fuel centers. We also operate 784 convenience stores, either directly or through franchisees, 323 fine jewelry stores and an online retailer.
We operate 38 food production plants, primarily bakeries and dairies, which supply approximately 40% of the corporate brand units sold in our supermarkets.
Our revenues are earned and cash is generated as consumer products are sold to customers in our stores. We earn income predominately by selling products at price levels that produce revenues in excess of the costs we incur to make these products available to our customers. Such costs include procurement and distribution costs, facility occupancy and operational costs, and overhead expenses. Our retail operations, which represent over 99% of our consolidated sales and EBITDA, is our only reportable segment.
On December 18, 2015, we closed our merger with Roundy’s by purchasing 100% of the Roundy’s outstanding common stock for $3.60 per share and assuming Roundy’s outstanding debt, for a purchase price of $866 million. Roundy’s is included in our ending Consolidated Balance Sheets for 2015 and in our Consolidated Statements of Operations for the last six weeks of 2015. Certain year-over-year comparisons will be affected as a result. See Note 2meaning ascribed thereto pursuant to the Consolidated Financial Statements for more information related to our merger with Roundy’s.
On August 18, 2014, we closed our merger with Vitacost.com by purchasing 100% of the Vitacost. com outstanding common stock for $8.00 per share or $287 million. Vitacost.com is included in our ending Consolidated Balance Sheets and Consolidated Statements of Operations for 2014 and 2015. See Note 2 to the Consolidated Financial Statements for more information related to our merger with Vitacost.com.
On January 28, 2014, we closed our merger with Harris Teeter by purchasing 100% of the Harris Teeter outstanding common stock for approximately $2.4 billion. Harris Teeter is included in our ending Consolidated Balance Sheets for 2014 and 2015 and in our Consolidated Statements of Operations for 2014 and 2015. Due to the timing of the merger closing late in fiscal year 2013, its results of operations were not material to our consolidated results of operations for 2013. Certain year-over-year comparisons will be affected as a result. See Note 2 to the Consolidated Financial Statements for more information related to our merger with Harris Teeter.
OUR 2015 PERFORMANCE
We achieved outstanding results in 2015. Our business strategy continues to resonate with a full range of customers and our results reflect the balance we seek to achieve across our business including positive identical supermarket sales growth, increases in loyal household count, and good cost control, as well as growth in net earnings and net earnings per diluted share. Our 2015 net earnings were $2.0 billion or $2.06 per diluted share, compared to $1.7 billion, or $1.72 per diluted share for 2014. All share and per share amounts presented are reflective of the two-for-one stock split that began trading at the split adjusted price on July 14, 2015.
Our net earnings for 2015 include a $110 million expense to operating, general, and administrative (“OG&A”) for certain contributions to the United Food and Commercial Workers International Union (“UFCW”) Consolidated Pension Plan (“2015 UFCW Contributions”) made during the third and fourth quarters of 2015. In addition, our net earnings for 2015 include a lower last-in, first-out (“LIFO”) charge compared to 2014. Net earnings for 2014 include a net $39 million after-tax charge for an $87 million ($56 million after-tax) charge to OG&A due to the commitments and withdrawal liabilities arising from restructuring of certain multi-employer obligations (“2014 Multi-Employer Pension Plan Obligation”) to help stabilize associates’ future pension benefits, offset partially by the benefits from certain tax items of $17 million (“2014 Adjusted
A-7
Items”). In addition, our net earnings for 2014 include unusually high fuel margins, partially offset by a LIFO charge that was significantly higher than 2013 and $140 million in contributions charged to OG&A expenses for the UFCW Consolidated Pension Plan ($55 million) and The Kroger Co. Foundation ($85 million) (“2014 Contributions”). The 2015 and 2014 contributions to the UFCW Consolidated Pension Plan was to further fund the plan. The $85 million contribution, in 2014, to The Kroger Co. Foundation will enable it to continue to support causes such as hunger relief, breast cancer awareness, the military and their families and local community organizations. Fuel margin per gallon was $0.19 in 2014, compared to $0.14 in 2013. Our net earnings for 2013 include a net benefit of $23 million, which includes benefits from certain tax items of $40 million, offset partially by costs of $11 million in interest and $16 million in OG&A expenses ($17 million after-tax) related to our merger with Harris Teeter (“2013 Adjusted Items”).
Our 2015 net earnings were $2.0 billion or $2.06 per diluted share, compared to $1.7 billion, or $1.72 per diluted share for 2014. Net earnings for 2015 totaled $2.0 billion, or $2.06 per diluted share, compared to net earnings in 2014 of $1.8 billion, or $1.76 per diluted share, excluding the 2014 Adjusted Items. We believe adjusted net earnings and adjusted net earnings per diluted share present a more accurate year-over-year comparison of our financial results because the 2014 Adjusted Items were not the result of our normal operations. Our net earnings per diluted share for 2015 represent a 17% increase, compared to 2014 adjusted net earnings per diluted share. Please refer to the “Net Earnings” section of MD&A for more information.
Our identical supermarket sales increased 5.0%, excluding fuel, in 2015, compared to 2014. We have achieved 49 consecutive quarters of positive identical supermarket sales growth, excluding fuel. As we continue to outpace many of our competitors on identical supermarket sales growth, we continue to gain market share. We focus on identical supermarket sales growth, excluding fuel, as it is a key performance target for our long-term growth strategy.
Increasing market share is an important part of our long-term strategy as it best reflects how our products and services resonate with customers. Market share growth allows us to spread the fixed costs in our business over a wider revenue base. Our fundamental operating philosophy is to maintain and increase market share by offering customers good prices and superior products and service. Based on Nielsen POS+ data, our overall market share of the products we sell in markets in which we operate increased by approximately 40 basis points in 2015. This data also indicates that our market share increased in 17 markets and declined in one. These market share results reflect our long-term strategy of market share growth.
RESULTS OF OPERATIONS
The following discussion summarizes our operating results for 2015 compared to 2014 and for 2014 compared to 2013. Comparability is affected by income and expense items that fluctuated significantly between and among the periods, our merger with Roundy’s in late 2015 and our merger with Harris Teeter in late 2013. All share and per share amounts presented below are reflective of the two-for-one stock split that began trading at the split adjusted price on July 14, 2015.
Management believes adjusted net earnings (and adjusted net earnings per diluted share) are useful metrics to investors and analysts because they more accurately reflect our day-to-day business operations than do the generally accepted accounting principle (“GAAP”) measures of net earnings and net earnings per diluted share. Adjusted net earnings (and adjusted net earnings per diluted share) are non-generally accepted accounting principle (“non-GAAP”) financial measures and should not be considered alternatives to net earnings (and net earnings per diluted share) or any other GAAP measure of performance. Adjusted net earnings (and adjusted net earnings per diluted share) should not be viewed in isolation or considered substitutes for our financial results as reported in accordance with GAAP. Management uses adjusted net earnings (and adjusted net earnings per diluted share) in evaluating our results of operations as it believes these measures are more meaningful indicators of operating performance since, as adjusted, those earnings relate more directly to our day-to-day operations. Management also uses adjusted net earnings (and adjusted net earnings per diluted share) as a performance metric for management incentive programs, and to measure our progress against internal budgets and targets.
A-8
Net Earnings
Net earnings totaled $2.0 billion in 2015, $1.7 billion in 2014 and $1.5 billion in 2013. Net earnings improved in 2015, compared to net earnings in 2014, due to an increase in operating profit, partially offset by an increase in income tax expense. Operating profit increased in 2015, compared to 2014, primarily due to an increase in first-in, first-out (“FIFO”) non-fuel operating profit, lower charges for total contributions to The Kroger Co. Foundation, UFCW Consolidated Pension Plan, the charge related to the 2014 Multi-Employer Pension Plan Obligation and a lower LIFO charge which was $28 million (pre-tax), compared to a LIFO charge of $147 million (pre-tax) in 2014, partially offset by a decrease in fuel operating profit and continued investments in lower prices for our customers. The decrease in fuel operating profit was primarily due to a decrease in fuel margin per gallon to $0.17 in 2015, compared to $0.19 in 2014, partially offset by an increase in fuel gallons sold. Continued investments in lower prices for our customers includes our pharmacy department, which experienced high levels of inflation that were not fully passed on to the customer in 2015. Net earnings improved in 2014, compared to net earnings in 2013, due to an increase in operating profit, partially offset by increases in interest and income tax expense. Operating profit increased in 2014, compared to 2013, primarily due to an increase in FIFO non-fuel operating profit, excluding Harris Teeter, the effect of our merger with Harris Teeter and an increase in fuel operating profit, partially offset by continued investments in lower prices for our customers, the 2014 Contributions, the charge related to the 2014 Multi-Employer Pension Plan Obligation and a higher LIFO charge which was $147 million (pre-tax), compared to a LIFO charge of $52 million (pre-tax) in 2013.
The net earnings for 2015 do not include any non-GAAP adjustments. The net earnings for 2014 include a net charge of $39 million, after tax, related to the 2014 Adjusted Items. The net earnings for 2013 include a net benefit of $23 million, after tax, related to the 2013 Adjusted Items. Excluding these benefits and charges for Adjusted Items for 2014 and 2013, adjusted net earnings were $2.0 billion in 2015, $1.8 billion in 2014 and $1.5 billion in 2013. 2015 net earnings improved, compared to adjusted net earnings in 2014, due to an increase in FIFO non-fuel operating profit, lower charges for total contributions to The Kroger Co. Foundation and UFCW Consolidated Pension Plan and a lower LIFO charge which was $28 million (pre-tax), compared to a LIFO charge of $147 million (pre-tax) in 2014, partially offset by continued investments in lower prices for our customers, a decrease in fuel operating profit and an increase in income tax expense. Continued investments in lower prices for our customers includes our pharmacy department, which experienced high levels of inflation that were not fully passed on to the customer in 2015. 2014 adjusted net earnings improved, compared to adjusted net earnings in 2013, due to an increase in FIFO non-fuel operating profit, excluding Harris Teeter, the effect of our merger with Harris Teeter and an increase in fuel operating profit, partially offset by continued investments in lower prices for our customers, the 2014 Contributions, increases in interest and income tax expense and a higher LIFO charge which was $147 million (pre-tax), compared to a LIFO charge of $52 million (pre-tax) in 2013.
Net earnings per diluted share totaled $2.06 in 2015, $1.72 in 2014 and $1.45 in 2013. Net earnings per diluted share in 2015, compared to 2014, increased primarily due to fewer shares outstanding as a result of the repurchase of Kroger common shares and an increase in net earnings. Net earnings per diluted share in 2014, compared to 2013, increased primarily due to fewer shares outstanding as a result of the repurchase of Kroger common shares and an increase in net earnings.
There were no adjustment items in 2015, but excluding the 2014 and 2013 Adjusted Items, adjusted net earnings per diluted share totaled $1.76 in 2014 and $1.43 in 2013. Net earnings per diluted share in 2015, compared to adjusted net earnings per diluted share in 2014, increased primarily due to fewer shares outstanding as a result of the repurchase of Kroger common shares and an increase in adjusted net earnings. Adjusted net earnings per diluted share in 2014, compared to adjusted net earnings per diluted share in 2013, increased primarily due to fewer shares outstanding as a result of the repurchase of Kroger common shares and an increase in adjusted net earnings.
A-9
The following table provides a reconciliation of net earnings attributable to The Kroger Co. to net earnings attributable to The Kroger Co. excluding Adjusted Items for 2014 and 2013 and a reconciliation of net earnings attributable to The Kroger Co. per diluted common share to the net earnings attributable to The Kroger Co. per diluted common share excluding Adjusted Items for 2014 and 2013. In 2015, we did not have any adjustment items that affect net earnings or net earnings per diluted share.
Net Earnings per Diluted Share excluding the Adjusted Items(in millions, except per share amounts)
| 2015 | 2014 | 2013 | ||||||||
| Net earnings attributable to The Kroger Co. | $ | 2,039 | $ | 1,728 | $ | 1,519 | ||||
| 2014 Adjusted Items | — | 39 | — | |||||||
| 2013 Adjusted Items | — | — | (23 | ) | ||||||
| Net earnings attributable to The Kroger Co. excluding the | ||||||||||
| adjustment items above | $ | 2,039 | $ | 1,767 | $ | 1,496 | ||||
| Net earnings attributable to The Kroger Co. per diluted common share | $ | 2.06 | $ | 1.72 | $ | 1.45 | ||||
| 2014 Adjusted Items(1) | — | 0.04 | — | |||||||
| 2013 Adjusted Items(1) | — | — | (0.02 | ) | ||||||
| Net earnings attributable to The Kroger Co. per diluted common share | ||||||||||
| excluding the adjustment items above | $ | 2.06 | $ | 1.76 | $ | 1.43 | ||||
| Average numbers of common shares used in diluted calculation | 980 | 993 | 1,040 | |||||||
Sales
| Total Sales | |||||||||||||||||||
| (in millions) | |||||||||||||||||||
| Percentage | Percentage | ||||||||||||||||||
| 2015 | Increase(2) | 2014 | Increase(3) | 2013 | |||||||||||||||
| Total supermarket sales | |||||||||||||||||||
| without fuel | $ | 91,310 | 5.8 | % | $ | 86,281 | 12.5 | % | $ | 76,666 | |||||||||
| Fuel sales | 14,804 | (21.5 | % | ) | 18,850 | (0.6 | %) | 18,962 | |||||||||||
| Other sales(1) | 3,716 | 11.5 | % | 3,334 | 21.4 | % | 2,747 | ||||||||||||
| Total sales | $ | 109,830 | 1.3 | % | $ | 108,465 | 10.3 | % | $ | 98,375 | |||||||||
Total sales increased in 2015, compared to 2014, by 1.3%. This increase in 2015 total sales, compared to 2014, was primarily due to an increase in identical supermarket sales, excluding fuel, of 5.0%. Total sales also increased due to the inclusion of Roundy’s sales, due to our merger, for the period of December 18, 2015 to January 30, 2016. Identical supermarket sales, excluding fuel, for 2015, compared to 2014, increased primarily due to an increase in the number of households shopping with us, an increase in visits per household, changes in product mix and product cost inflation. Total fuel sales decreased in 2015, compared to 2014, primarily due to a 26.7% decrease in the average retail fuel price, partially offset by an increase in fuel gallons sold of 7.1%.
Total sales increased in 2014, compared to 2013, by 10.3%. This increase in 2014 total sales, compared to 2013, was primarily due to our merger with Harris Teeter, which closed on January 28, 2014, and an increase in identical supermarket sales, excluding fuel, of 5.2%. Identical supermarket
A-10
sales, excluding fuel for 2014, compared to 2013, increased primarily due to an increase in the number of households shopping with us, an increase in visits per household and product cost inflation. Total fuel sales decreased in 2014, compared to 2013, primarily due to a 6.8% decrease in the average retail fuel price, partially offset by an increase in fuel gallons sold of 6.6%.
We define a supermarket as identical when it has been in operation without expansion or relocation for five full quarters. Although identical supermarket sales is a relatively standard term, numerous methods exist for calculating identical supermarket sales growth. As a result, the method used by our management to calculate identical supermarket sales may differ from methods other companies use to calculate identical supermarket sales. We urge you to understand the methods used by other companies to calculate identical supermarket sales before comparing our identical supermarket sales to those of other such companies. Fuel discounts received at our fuel centers and earned based on in-store purchases are included in all of the supermarket identical sales results calculations illustrated below and reduce our identical supermarket sales results. Differences between total supermarket sales and identical supermarket sales primarily relate to changes in supermarket square footage. Identical supermarket sales include sales from all departments at identical Fred Meyer multi-department stores and include Roundy’s sales for the last six weeks of fiscal 2015 for stores that are identical as if they were part of the Company in the prior year. We calculate annualized identical supermarket sales by adding together four quarters of identical supermarket sales. Our identical supermarket sales results are summarized in the table below.
Identical Supermarket Sales(dollars in millions)
| 2015 | 2014 | |||||||
| Including supermarket fuel centers | $ | 98,916 | $ | 97,813 | ||||
| Excluding supermarket fuel centers | $ | 87,553 | $ | 83,349 | ||||
| Including supermarket fuel centers | 1.1 | % | 4.2 | % | ||||
| Excluding supermarket fuel centers | 5.0 | % | 5.2 | % | ||||
Gross Margin and FIFO Gross Margin
We calculate gross margin as sales less merchandise costs, including advertising, warehousing, and transportation expenses. Merchandise costs exclude depreciation and rent expenses. Our gross margin rates, as a percentage of sales, were 22.16% in 2015, 21.16% in 2014 and 20.57% in 2013. The increase in 2015, compared to 2014, resulted primarily from a decrease in retail fuel sales and reductions in transportation costs and a decrease in our LIFO charge, as a percentage of sales, partially offset by continued investments in lower prices for our customers and increased shrink costs, as a percentage of sales. The increase in 2014, compared to 2013, resulted primarily from the effect of our merger with Harris Teeter, an increase in fuel gross margin rate and a reduction in warehouse and transportation costs, as a percentage of sales, partially offset by continued investments in lower prices for our customers and an increase in our LIFO charge, as a percentage of sales. The merger with Harris Teeter, which closed late in fiscal year 2013, had a positive effect on our gross margin rate in 2014 since Harris Teeter has a higher gross margin rate as compared to total Company without Harris Teeter. The increase in fuel gross margin rate for 2014, compared to 2013, resulted primarily from an increase in fuel margin per gallon sold of $0.19 in 2014, compared to $0.14 in 2013. Our retail fuel operations lower our gross margin rate, as a percentage of sales, due to the very low gross margin on retail fuel sales as compared to non-fuel sales. A lower growth rate in retail fuel sales, as compared to the growth rate for the total Company, increases the gross margin rates, as a percentage of sales, when compared to the prior year.
We calculate FIFO gross margin as sales less merchandise costs, including advertising, warehousing, and transportation expenses, but excluding the LIFO charge. Merchandise costs exclude depreciation and rent expenses. Our LIFO charge was $28 million in 2015, $147 million in 2014 and $52 million in 2013. FIFO gross margin is a non-GAAP financial measure and should not be considered as an alternative to gross margin or any other GAAP measure of performance. FIFO gross margin should not be reviewed in isolation or considered as a substitute for our financial results as reported in accordance
A-11
with GAAP. FIFO gross margin is an important measure used by management to evaluate merchandising and operational effectiveness. Management believes FIFO gross margin is a useful metric to investors and analysts because it measures our day-to-day merchandising and operational effectiveness.
Our FIFO gross margin rates, as a percentage of sales, were 22.18% in 2015, 21.30% in 2014 and 20.62% in 2013. Our retail fuel operations lower our FIFO gross margin rate, as a percentage of sales, due to the very low FIFO gross margin rate on retail fuel as compared to non-fuel sales. Excluding the effect of retail fuel operations, our FIFO gross margin rate decreased four basis points in 2015, as a percentage of sales, compared to 2014. The decrease in FIFO gross margin rates, excluding retail fuel, in 2015, compared to 2014, resulted primarily from continued investments in lower prices for our customers and increased shrink costs, partially offset by a reduction in transportation costs, as a percentage of sales. Excluding the effect of retail fuel, our FIFO gross margin rate decreased three basis points in 2014, as a percentage of sales, compared to 2013. The decrease in FIFO gross margin rates, excluding retail fuel, in 2014, compared to 2013, resulted primarily from continued investments in lower prices for our customers, offset partially by the effect of our merger with Harris Teeter and a reduction of warehouse and transportation costs, as a percentage of sales.
LIFO Charge
The LIFO charge was $28 million in 2015, $147 million in 2014 and $52 million in 2013. In 2015, we experienced lower product cost inflation, compared to 2014, which resulted in a lower LIFO charge. In 2015, our LIFO charge primarily resulted from annualized product cost inflation related to pharmacy, and was partially offset by annualized product cost deflation related to meat and dairy. In 2014, we experienced higher product cost inflation, compared to 2013, which resulted in a higher LIFO charge. In 2014, our LIFO charge primarily resulted from annualized product cost inflation related to pharmacy, grocery, deli, meat and seafood. In 2013, our LIFO charge resulted primarily from an annualized product cost inflation related to meat, seafood and pharmacy.
Operating, General and Administrative Expenses
OG&A expenses consist primarily of employee-related costs such as wages, health care benefits and retirement plan costs, utilities and credit card fees. Rent expense, depreciation and amortization expense and interest expense are not included in OG&A.
OG&A expenses, as a percentage of sales, were 16.34% in 2015, 15.82% in 2014 and 15.45% in 2013. The increase in OG&A expenses, as a percentage of sales, in 2015, compared to 2014, resulted primarily from a decrease in retail fuel sales, increases in EMV chargebacks, company sponsored pension, healthcare and incentive plan costs, as a percentage of sales, partially offset by increased supermarket sales, the 2014 Multi-Employer Pension Plan Obligation, lower charges for total contributions to The Kroger Foundation and UFCW Consolidated Pension Plan, productivity improvements and effective cost controls at the store level. The increase in OG&A expenses, as a percentage of sales, in 2014, compared to 2013, resulted primarily from the 2014 Contributions, the 2014 Multi-Employer Pension Plan Obligation, the effect of fuel, the effect of our merger with Harris Teeter and increases in credit card fees and incentive plan costs, as a percentage of sales, partially offset by increased supermarket sales growth, productivity improvements and effective cost controls at the store level. Retail fuel sales lower our OG&A rate due to the very low OG&A rate, as a percentage of sales, of retail fuel sales compared to non-fuel sales. The merger with Harris Teeter, which closed late in fiscal year 2013, increased our OG&A rate, as a percentage of sales, since Harris Teeter has a higher OG&A rate as compared to the total Company without Harris Teeter.
Our retail fuel operations reduce our overall OG&A rate, as a percentage of sales, due to the very low OG&A rate on retail fuel sales as compared to non-fuel sales. OG&A expenses, as a percentage of sales excluding fuel, the 2015 UFCW Contributions, the 2014 Contributions and the 2014 Multi-Employer Pension Plan Obligation, decreased 9 basis points, compared to 2014. The decrease in our adjusted OG&A rate in 2015, compared to 2014, resulted primarily from increased supermarket sales, productivity improvements and effective cost controls at the store level, partially offset by increases in
A-12
EMV chargebacks, company sponsored pension, healthcare and incentive plan costs, as a percentage of sales. OG&A expenses, as a percentage of sales excluding fuel, the 2014 Contributions and the 2014 Multi-Employer Pension Plan Obligation, decreased 19 basis points in 2014, compared to 2013, adjusted for the 2013 Adjusted Items. The decrease in our adjusted OG&A rate in 2014, compared to 2013, resulted primarily from increased supermarket sales growth, productivity improvements and effective cost controls at the store level, offset partially by the effect of our merger with Harris Teeter and increases in credit card fees and incentive plan costs, as a percentage of sales.
Rent Expense
Rent expense was $723 million in 2015, compared to $707 million in 2014 and $613 million in 2013. Rent expense, as a percentage of sales, was 0.66% in 2015, compared to 0.65% in 2014 and 0.62% in 2013. Rent expense increased in 2015, compared to 2014, due to the effect of our merger with Roundy’s, partially offset by our continued emphasis on owning rather than leasing, whenever possible. Rent expense, as a percentage of sales, in 2015 was consistent with 2014 due to the effect of our merger with Roundy’s, partially offset by our continued emphasis to own rather than lease, whenever possible, and the benefit of increased sales. The increase in rent expense, as a percentage of sales, in 2014, compared to 2013, is due to the effect of our merger with Harris Teeter, partially offset by our continued emphasis to own rather than lease, whenever possible, and the benefit of increased sales. The merger with Harris Teeter, which closed late in fiscal year 2013, increased rent expense, as a percentage of sales, since Harris Teeter has a higher rent expense rate compared to the total Company without Harris Teeter.
Depreciation and Amortization Expense
Depreciation and amortization expense was $2.1 billion, compared to $1.9 billion in 2014 and $1.7 billion in 2013. Depreciation and amortization expense, as a percentage of sales, was 1.90% in 2015, 1.80% in 2014 and 1.73% in 2013. The increase in depreciation and amortization expense for 2015, compared to 2014, was the result of additional depreciation due to our merger with Roundy’s and on capital investments, including mergers and lease buyouts, of $3.4 billion, excluding Roundy’s. The increase in depreciation and amortization expense, as a percentage of sales, from 2015, compared to 2014, is primarily due to the additional depreciation resulting from our increased capital investments, including mergers and lease buyouts in 2015, compared to 2014. The increase in depreciation and amortization expense for 2014, compared to 2013, in total dollars, was due to the effect of our merger with Harris Teeter and our increased spending in capital investments, including mergers and lease buyouts, of $3.1 billion in 2014. The increase in depreciation and amortization expense, as a percentage of sales, from 2014, compared to 2013, is primarily due to the effect of our merger with Harris Teeter and our increased spending in capital investments, partially offset by increased supermarket sales. The merger with Harris Teeter, which closed late in fiscal year 2013, increased our depreciation and amortization expense, as a percentage of sales, since Harris Teeter has a higher depreciation expense rate as compared to the total Company without Harris Teeter.
Operating Profit and Adjusted FIFO Operating Profit
Operating profit was $3.6 billion in 2015, $3.1 billion in 2014 and $2.7 billion in 2013. Operating profit, as a percentage of sales, was 3.26% in 2015, 2.89% in 2014 and 2.77% in 2013. Operating profit, as a percentage of sales, increased 37 basis points in 2015, compared to 2014, primarily from increased supermarket sales, a LIFO charge that was significantly lower in 2015, lower charges for total contributions to The Kroger Co. Foundation and UFCW Consolidated Pension Plan, the 2014 Multi-Employer Pension Obligation, productivity improvements, effective cost controls at the store level, and reductions in transportation costs, as a percentage of sales, partially offset by the effect of our merger with Roundy’s, continued investments in lower prices for our customers, a decrease in operating profit from our fuel operations, an increase in depreciation and amortization expense and increases in EMV chargebacks, company sponsored pension, healthcare, incentive plan and shrink costs, as a percentage of sales. The decrease in operating profit from our fuel operations for 2015, compared to 2014, resulted primarily from a decrease in the average margin per gallon of fuel sold, partially offset by an increase in
A-13
fuel gallons sold. Operating profit, as a percentage of sales, increased 12 basis points in 2014, compared to 2013, primarily from the effect of our merger with Harris Teeter, an increase in fuel gross margin rate and a reduction in warehouse and transportation costs, rent and depreciation and amortization expenses, as a percentage of sales, partially offset by continued investments in lower prices for our customers and an increase in the LIFO charge, as a percentage of sales.
We calculate FIFO operating profit as operating profit excluding the LIFO charge. FIFO operating profit is a non-GAAP financial measure and should not be considered as an alternative to operating profit or any other GAAP measure of performance. FIFO operating profit should not be reviewed in isolation or considered as a substitute for our financial results as reported in accordance with GAAP. FIFO operating profit is an important measure used by management to evaluate operational effectiveness. Management believes FIFO operating profit is a useful metric to investors and analysts because it measures our day-to-day merchandising and operational effectiveness. Since fuel discounts are earned based on in-store purchases, fuel operating profit does not include fuel discounts, which are allocated to our in-store supermarket location departments. We also derive OG&A, rent and depreciation and amortization expenses through the use of estimated allocations in the calculation of fuel operating profit.
FIFO operating profit was $3.6 billion in 2015, $3.3 billion in 2014 and $2.8 billion in 2013. FIFO operating profit, as a percentage of sales, was 3.28% in 2015, 3.03% in 2014 and 2.82% in 2013. FIFO operating profit, excluding the 2015 UFCW Contributions, the 2014 Contributions, the 2014 Multi-Employer Pension Plan Obligation and 2013 Adjusted Items, was $3.7 billion in 2015, $3.5 billion in 2014 and $2.8 billion in 2013. FIFO operating profit, as a percentage of sales excluding the 2015 UFCW Contributions, the 2014 Contributions, the 2014 Multi-Employer Pension Plan Obligation and 2013 Adjusted Items, was 3.38% in 2015, 3.24% in 2014 and 2.84% in 2013.
Retail fuel sales lower our overall FIFO operating profit rate due to the very low FIFO operating profit rate, as a percentage of sales, of retail fuel sales compared to non-fuel sales. FIFO operating profit, as a percentage of sales excluding fuel, the 2015 UFCW Contributions, the 2014 Contributions and the 2014 Multi-Employer Pension Plan Obligation, increased 5 basis points in 2015, compared to 2014. The increase in our adjusted FIFO operating profit rate in 2015, compared to 2014, was primarily due to increased supermarket sales, productivity improvements, effective cost controls at the store level and reductions in transportation costs, as a percentage of sales, partially offset by continued investments in lower prices for our customers, the effect of our merger with Roundy’s, an increase in depreciation and amortization expense and increases in EMV chargebacks, company sponsored pension, healthcare, incentive plan and shrink costs, as a percentage of sales. Excluding the effects of our merger with Roundy’s, FIFO operating profit increased 8 basis points in 2015, compared to 2014. FIFO operating profit, as a percentage of sales, excluding fuel, the 2014 Contributions and the 2014 Multi-Employer Pension Plan Obligation, increased 10 basis points in 2014, compared to 2013, adjusted for the 2013 Adjusted Items. The increase in our adjusted FIFO operating profit rate in 2014, compared to 2013, was primarily due to the effect of our merger with Harris Teeter and a reduction in warehouse and transportation costs, improvements in OG&A, rent and depreciation and amortization expense, as a percentage of sales, partially offset by continued investments in lower prices for our customers.
Interest Expense
Interest expense totaled $482 million in 2015, $488 million in 2014 and $443 million in 2013. The decrease in interest expense in 2015, compared to 2014, resulted primarily due to the timing of debt principal payments and debt issuances, partially offset by an increase in interest expense associated with our commercial paper program. The increase in interest expense in 2014, compared to 2013, resulted primarily from an increase in net total debt, primarily due to financing the merger with Harris Teeter and repurchases of our outstanding common shares.
Income Taxes
Our effective income tax rate was 33.8% in 2015, 34.1% in 2014 and 32.9% in 2013. The 2015, 2014 and 2013 tax rate differed from the federal statutory rate primarily as a result of the utilization of tax credits, the Domestic Manufacturing Deduction and other changes, partially offset by the effect of state income taxes.
A-14
COMMON SHARE REPURCHASE PROGRAMS
We maintain share repurchase programs that comply with Rule 10b5-1proxy rules of the Securities Exchange Act of 1934, and allowas amended (the “Exchange Act”).
(g) Within the time period specified in Section 2(B)(3)(b) for the orderly repurchaseProxy Access Nomination Notice, an Eligible Shareholder must provide in writing to the secretary of our common shares, from timethe Company, with respect to time. We made open market purchases of our common shares totaling $500 millionthe Shareholder Nominee, in 2015, $1.1 billion in 2014 and $338 million in 2013 under these repurchase programs. In addition to these repurchase programs, we also repurchase common sharesthe information and representations required to reduce dilution resulting from our employee stock option plans. This program is solely funded by proceeds from stock option exercises,be provided in the shareholder’s notice pursuant to Section 2(B)(2), representations and agreements that such person: (i) has read and agrees to adhere to the tax benefit from these exercises. We repurchased approximately $203 million in 2015, $155 million in 2014Company’s code of conduct, corporate governance guidelines, conflict of interest, confidentiality and $271 million in 2013 of our common shares under the stock option program.
The shares repurchased in 2015 were acquired under two separate share repurchase programs. The first is a $500 million repurchase program that was authorized by our Board of Directors on June 26, 2014. The second is a program that uses the cash proceeds from the exercises of stock options by participants in our stock optionownership and long-term incentive planssecurities trading policies, and any other policies and guidelines applicable to directors, as well as any applicable law, rule or regulation or listing requirement; (ii) is not and will not become a party to any agreement, arrangement or understanding with, and has not given any commitment or assurance to, any person or entity as to how such person, if elected as a director of the associated tax benefits. On June 25, 2015, ourCompany, will act or vote on any issue or question (a “Voting Commitment”) that has not been disclosed to the Company, and (iii) is not and will not become a party to any agreement, arrangement or understanding with any person or entity other than the Company with respect to any direct or indirect compensation, reimbursement or indemnification (a “Compensation Arrangement”) in connection with such person’s nomination for director and/or service as a director, that has not been disclosed to the Company. At the request of the Company, the Proxy Access Nominee must complete, sign and submit all questionnaires required of the Board of Directors approved a new $500 million share repurchase programdirectors within five business days of receipt of each such questionnaire from the Company and provide within five business days of the Company’s request such additional information as the Company determines may be necessary to replace our prior authorization, which had been exhausted. As of January 30, 2016, we have not repurchased any shares utilizingpermit the June 25, 2015 repurchase program. On March 10, 2016, our Board of Directors approved a new $500 million share repurchase programdirectors to supplementdetermine whether such Proxy Access Nominee meets the 2015 Repurchase Program,requirements of this Section 2(B)(3) and/or satisfies the Board Qualifications, including whether: (1) such Proxy Access Nominee is independent under the listing standards of each principal U.S. exchange upon which the Company’s shares are listed, any applicable rules of the SEC, and any publicly disclosed standards used by the Board of directors in determining and disclosing the independence of members of the Board of directors (the “Independence Standards”), (2) such Proxy Access Nominee has any direct or indirect relationship with the Company, and (3) such Proxy Access Nominee is expectednot and has not been subject to any event specified in Item 401(f) of RegulationS-K under the Securities Act of 1933, as amended (the “Securities Act”), or any order of the type specified in Rule 506(d) of Regulation D under the Securities Act.
(h) Within the time period specified in Section 2(B)(3)(b) for the Proxy Access Nomination Notice, an Eligible Shareholder must provide the following information, representations and agreements: (i) the information and representations that would be required to be exhaustedset forth in shareholder’s notice of a nomination pursuant to Section 2(B)(1); (ii) one or more written statements from the record holder of the shares (and from each intermediary through which the shares are or have been held during the requisite three-year holding period) verifying that, as of a date within seven calendar days prior to the date the Proxy Access Nomination Notice is received by the endsecretary of the second quarter of 2016.
CAPITAL INVESTMENTS
Capital investments, including changes in construction-in-progress payablesCompany, the Eligible Shareholder owns, and excluding mergershas owned continuously for the preceding three years, the Required Shares, and the purchaseEligible Shareholder’s agreement to provide (1) written statements from the record holder and intermediaries verifying the Eligible Shareholder’s continuous ownership of leased facilities, totaled $3.3 billion in 2015, $2.8 billion in 2014 and $2.3 billion in 2013. Capital investments for mergers totaled $168 million in 2015, $252 million in 2014 and $2.3 billion in 2013. Payments for mergersthe Required Shares through the record date by not later than the close of $168 million in 2015, $252 million in 2014 and $2.3 billion in 2013 relate to our mergers with Roundy’s, Vitacost.com and Harris Teeter, respectively. Refer to Note 2business on the fifth business day after (A) the record date (if, prior to the Consolidated Financial Statements for more information onrecord date, the mergersCompany (x) disclosed such date by press release or any filing with Roundy’s, Vitacost.com and Harris Teeter. Capital investments for the purchase of leased facilities totaled $35 million in 2015, $135 million in 2014 and $108 million in 2013. The table below shows our supermarket storing activity and our total food store square footage:
Supermarket Storing Activity
| 2015 | 2014 | 2013 | |||||||
| Beginning of year | 2,625 | 2,640 | 2,424 | ||||||
| Opened | 31 | 33 | 17 | ||||||
| Opened (relocation) | 12 | 13 | 7 | ||||||
| Acquired | 159 | — | 227 | ||||||
| Closed (operational) | (37 | ) | (48 | ) | (28 | ) | |||
| Closed (relocation) | (12 | ) | (13 | ) | (7 | ) | |||
| End of year | 2,778 | 2,625 | 2,640 | ||||||
| Total food store square footage (in millions) | 173 | 162 | 161 | ||||||
RETURN ON INVESTED CAPITAL
We calculate return on invested capital (“ROIC”) by dividing adjusted operating profit for the prior four quarters by the average invested capital. Adjusted operating profit is calculated by excluding certain items included in operating profit, and adding back our LIFO charge, depreciation and amortization and rent to our U.S. GAAP operating profitSEC or (y) delivered a written notice of the record date (including by electronic mail) to the Eligible Shareholder) or (B) the date on which the Company delivered to the Eligible Shareholder written notice (including by electronic mail) of the record date (if such notice is
75
provided after the record date); and (2) immediate notice if the Eligible Shareholder ceases to own any of the Required Shares prior four quarters. Average invested capital is calculatedto the date of the annual meeting of shareholders; (iii) documentation satisfactory to the Company demonstrating that a group of funds are entitled to be treated as the sumone shareholder or person for purposes of (i) the average of our total assets, (ii) the average LIFO reserve, (iii) the average accumulated depreciation and amortization andthis Section 2(B)(3); (iv) a rent factor equal to total rent forrepresentation that the last four quarters multiplied by a factorEligible Shareholder (including each member of eight; minus (i) the average taxes receivable, (ii) the average trade accounts payable, (iii) the average accrued salaries and wages and (iv) the average other current liabilities, excluding accrued income taxes. Averages are calculated for ROIC by adding the beginning balanceany group of the first
A-15
quarter and the ending balance of the fourth quarter, of the last four quarters, and dividing by two. We use a factor of eight for our total rent as we believe this is a common factor used by our investors, analysts and rating agencies. ROIC is a non-GAAP financial measure of performance. ROIC should not be reviewed in isolation or considered as a substitute for our financial results as reported in accordance with GAAP. ROICshareholders that together is an important measure used by management to evaluate our investment returns on capital. Management believes ROIC is a useful metric to investors and analysts because it measures how effectively we are deploying our assets.
Although ROIC is a relatively standard financial term, numerous methods exist for calculating a company’s ROIC. As a result,Eligible Shareholder hereunder): (1) acquired the method used by our management to calculate ROIC may differ from methods other companies use to calculate their ROIC. We urge you to understand the methods used by other companies to calculate their ROIC before comparing our ROIC to that of such other companies.
The following table provides a calculation of ROIC for 2015 and 2014. The 2015 calculation of ROIC excludes the financial position, results and merger costs for the Roundy’s transaction:
| January 30, | January 31, | |||||||||
| 2016 | 2015 | |||||||||
| Return on Invested Capital | ||||||||||
| Numerator | ||||||||||
| Operating profit | $ | 3,576 | $ | 3,137 | ||||||
| LIFO charge | 28 | 147 | ||||||||
| Depreciation and amortization | 2,089 | 1,948 | ||||||||
| Rent | 723 | 707 | ||||||||
| Adjustments for pension plan agreements | — | 87 | ||||||||
| Other | (13 | ) | — | |||||||
| Adjusted operating profit | $ | 6,403 | $ | 6,026 | ||||||
| Denominator | ||||||||||
| Average total assets | $ | 32,197 | $ | 29,860 | ||||||
| Average taxes receivable(1) | (206 | ) | (19 | ) | ||||||
| Average LIFO reserve | 1,259 | 1,197 | ||||||||
| Average accumulated depreciation and amortization | 17,441 | 16,057 | ||||||||
| Average trade accounts payable | (5,390 | ) | (4,967 | ) | ||||||
| Average accrued salaries and wages | (1,359 | ) | (1,221 | ) | ||||||
| Average other current liabilities(2) | (3,054 | ) | (2,780 | ) | ||||||
| Adjustment for Roundy’s merger | (714 | ) | — | |||||||
| Rent x 8 | 5,784 | 5,656 | ||||||||
| Average invested capital | $ | 45,958 | $ | 43,783 | ||||||
| Return on Invested Capital | 13.93 | % | 13.76 | % | ||||||
A-16
CRITICAL ACCOUNTING POLICIES
We have chosen accounting policies that we believe are appropriate to report accurately and fairly our operating results and financial position, and we apply those accounting policies in a consistent manner. Our significant accounting policies are summarized in Note 1 to the Consolidated Financial Statements.
The preparation of financial statements in conformity with GAAP requires us to make estimates and assumptions that affect the reported amounts of assets, liabilities, revenues, and expenses, and related disclosures of contingent assets and liabilities. We base our estimates on historical experience and other factors we believe to be reasonable under the circumstances, the results of which form the basis for making judgments about the carrying values of assets and liabilities that are not readily apparent from other sources. Actual results could differ from those estimates.
We believe that the following accounting policies are the most criticalRequired Shares in the preparation of our financial statements because they involve the most difficult, subjective or complex judgments about the effect of matters that are inherently uncertain.
Self-Insurance Costs
We primarily are self-insured for costs related to workers’ compensation and general liability claims. The liabilities represent our best estimate, using generally accepted actuarial reserving methods, of the ultimate obligations for reported claims plus those incurred but not reported for all claims incurred through January 30, 2016. We establish case reserves for reported claims using case-basis evaluation of the underlying claim data and we update as information becomes known.
For both workers’ compensation and general liability claims, we have purchased stop-loss coverage to limit our exposure to any significant exposure on a per claim basis. We are insured for covered costs in excess of these per claim limits. We account for the liabilities for workers’ compensation claims on a present value basis utilizing a risk-adjusted discount rate. A 25 basis point decrease in our discount rate would increase our liability by approximately $2 million. General liability claims are not discounted.
The assumptions underlying the ultimate costs of existing claim losses are subject to a high degree of unpredictability, which can affect the liability recorded for such claims. For example, variability in inflation rates of health care costs inherent in these claims can affect the amounts realized. Similarly, changes in legal trends and interpretations, as well as a change in the nature and method of how claims are settled can affect ultimate costs. Our estimates of liabilities incurred do not anticipate significant changes in historical trends for these variables, and any changes could have a considerable effect on future claim costs and currently recorded liabilities.
Impairments of Long-Lived Assets
We monitor the carrying value of long-lived assets for potential impairment each quarter based on whether certain triggering events have occurred. These events include current period losses combined with a history of losses or a projection of continuing losses or a significant decrease in the market value of an asset. When a triggering event occurs, we perform an impairment calculation, comparing projected undiscounted cash flows, utilizing current cash flow information and expected growth rates related to specific stores, to the carrying value for those stores. If we identify impairment for long-lived assets to be held and used, we compare the assets’ current carrying value to the assets’ fair value. Fair value is determined based on market values or discounted future cash flows. We record impairment when the carrying value exceeds fair market value. With respect to owned property and equipment held for disposal, we adjust the value of the property and equipment to reflect recoverable values based on our previous efforts to dispose of similar assets and current economic conditions. We recognize impairment for the excess of the carrying value over the estimated fair market value, reduced by estimated direct costs of disposal. We recorded asset impairments in the normalordinary course of business totaling $46 million in 2015, $37 million in 2014 and $39 million in 2013. We record costsnot with the intent to reducechange or influence control of the carrying value of long-lived assets in the Consolidated Statements of Operations as “Operating, generalCompany, and administrative” expense.
A-17
The factors that most significantly affect the impairment calculation are our estimates of future cash flows. Our cash flow projections look several years into the futuredoes not presently have such intent, (2) has not nominated and include assumptions on variables such as inflation, the economy and market competition. Application of alternative assumptions and definitions, such as reviewing long-lived assetswill not nominate for impairment at a different level, could produce significantly different results.
Goodwill
Our goodwill totaled $2.7 billion as of January 30, 2016. We review goodwill for impairment in the fourth quarter of each year, and also upon the occurrence of triggering events. We perform reviews of each of our operating divisions and variable interest entities (collectively, “reporting units”) that have goodwill balances. Fair value is determined using a multiple of earnings, or discounted projected future cash flows, and we compare fair valueelection to the carrying valueBoard of directors at the meeting any person other than the Proxy Access Nominee(s) being nominated pursuant to this Section 2(B)(3), (3) has not engaged and will not engage in, and has not and will not be, a reporting unit“participant” in another person’s “solicitation” within the meaning of Rule14a-1(l) under the Exchange Act in support of the election of any individual as a director at the annual meeting of shareholders other than its Proxy Access Nominee(s) or a nominee of the Board of directors, (4) will not distribute to any shareholder any form of proxy for the annual meeting of shareholders other than the form distributed by the Company, and (5) has provided and will provide facts, statements and other information in all communications with the Company and its shareholders that are or will be true and correct in all material respects and do not and will not omit to state a material fact necessary in order to make the statements made, in light of the circumstances under which they were made, not misleading; (v) a description of all agreements, arrangements or understandings between the Eligible Shareholder and each Shareholder Nominee and any other person or persons, including the Shareholder Nominee, such beneficial owners and control persons (naming such person or persons) pursuant to which the nomination or nominations are to be made by the Eligible Shareholder or that would be required to be disclosed pursuant to Rule 404 promulgated under RegulationS-K of the Exchange Act if the Eligible Shareholder making the nomination and any beneficial owner or control person on whose behalf the nomination is made, if any, or any affiliate or associate thereof or person acting in concert therewith, were the “registrant” for purposes of identifying potential impairment. We base projected future cash flows on management’s knowledgesuch rule and the Shareholder Nominee were a director or executive officer of such registrant (the “Related Person Agreements”); (vi) a description of any agreement, arrangement or understanding (including any derivative or short positions, profit interests, options, warrants, convertible securities, stock appreciation or similar rights, hedging transactions, and borrowed or loaned shares) that has been entered into as of the current operating environmentdate of the shareholder’s notice by, or on behalf of, such shareholder and expectationssuch beneficial owners, whether or not such instrument or right shall be subject to settlement in underlying shares of capital stock of the Company, the effect or intent of which is to mitigate loss to, manage risk or benefit of share price changes for, or increase or decrease the future. If we identify potential for impairment, we measurevoting power of, such stockholder or such beneficial owner, with respect to securities of the fair valueCompany; (vii) a representation as to whether the shareholder intends to be or is part of a reporting unit againstgroup that intends to deliver a proxy statement and/or form of proxy to holders of at least 10% of the fair valueshares entitled to vote or otherwise solicit proxies from shareholders in support of such proposal or nomination; and (viii) the written consent of each Proxy Access Nominee to be named in the Company’s proxy statement as a nominee and to serve as a director if elected; (ix) a copy of the Schedule 14N that has been filed with the SEC as required by Rule14a-18 under the Exchange Act; (x) in the case of a nomination by a group of shareholders that together is is an Eligible Shareholder, the designation by all group members of one group member that is authorized to act on behalf of all members of the nominating shareholder group with respect to the nominations and matters related thereto, including withdrawal of the nomination; and (xi) an undertaking that the Eligible Shareholder agrees to: (1) assume all liability stemming from any legal or regulatory violation arising out of the Eligible Shareholder’s communications with the Company’s shareholders or out of the information that the Eligible Shareholder provides to the Company, (2) indemnify and hold harmless the Company and each of its underlying assetsdirectors, officers and liabilities, excluding goodwill, to estimate an implied fair value of the reporting unit’s goodwill. We recognize goodwill impairment foremployees individually against any excess of the carrying value of the reporting unit’s goodwill over the implied fair value.
In 2015, goodwill increased $420 million primarily due to our merger with Roundy’s. In 2014, goodwill increased $169 million primarily due to our merger with Vitacost.com. For additional information related to the allocation of the purchase price for Roundy’s and Vitacost.com, refer to Note 2 to the Consolidated Financial Statements.
The annual evaluation of goodwill performed for our other reporting units during the fourth quarter of 2015, 2014 and 2013 did not result in impairment. Based on current and future expected cash flows, we believe goodwill impairments are not reasonably likely. A 10% reduction in fair value of our reporting units would not indicate a potential for impairment of our goodwill balance.
For additional information relating to our results of the goodwill impairment reviews performed during 2015, 2014 and 2013 see Note 3 to the Consolidated Financial Statements.
The impairment review requires the extensive use of management judgment and financial estimates. Application of alternative estimates and assumptions, such as reviewing goodwill for impairment at a different level, could produce significantly different results. The cash flow projections embedded in our goodwill impairment reviews can be affected by several factors such as inflation, business valuations in the market, the economy and market competition.
Store Closing Costs
We provide for closed store liabilities on the basis of the present value of the estimated remaining non-cancellable lease payments after the closing date, net of estimated subtenant income. We estimate the net lease liabilities using a discount rate to calculate the present value of the remaining net rent payments on closed stores. We usually pay closed store lease liabilities over the lease terms associated with the closed stores, which generally have remaining terms ranging from one to 20 years. Adjustments to closed store liabilities primarily relate to changes in subtenant income and actual exit costs differing from original estimates. We make adjustments for changes in estimates in the period in which the change becomes known. We review store closing liabilities quarterly to ensure that any accrued amount that is not a sufficient estimate of future costs is adjusted to earnings in the proper period.
We estimate subtenant income, future cash flows and asset recovery values based on our experience and knowledge of the market in which the closed store is located, our previous efforts to dispose of similar assets and current economic conditions. The ultimate cost of the disposition of the leases and the related assets is affected by current real estate markets, inflation rates and general economic conditions.
A-18
We reduce owned stores held for disposal to their estimated net realizable value. We account for costs to reduce the carrying values of property, equipment and leasehold improvements in accordance with our policy on impairment of long-lived assets. We classify inventory write-downsliability, loss or damages in connection with store closings, if any threatened or pending action, suit or proceeding, whether legal, administrative or investigative, against the Company or any of its directors, officers or employees arising out of any solicitation or other activity by the Eligible Shareholder in “Merchandise costs.” We expense costsconnection with its efforts to transfer inventory and equipment from closed stores as they are incurred.elect the Proxy Access Nominee pursuant to this Section 2(B)(3), (3) file with the SEC any solicitation with the Company’s
Post-Retirement Benefit Plans
We account for our defined benefit pension plans using the recognition and disclosure provisions of GAAP, which require the recognition of the funded status of retirement plans on the Consolidated Balance Sheet. We record, as a component of Accumulated Other Comprehensive Income (“AOCI”), actuarial gains or losses, prior service costs or credits and transition obligations that have not yet been recognized.76
The determination of our obligation and expense for Company-sponsored pension plans and other post-retirement benefits is dependent upon our selection of assumptions used by actuaries in calculating those amounts. Those assumptions are described in Note 15
shareholders relating to the Consolidated Financial Statements and include, among others, the discount rate, the expected long-term rate of return on plan assets, mortality and the rate of increases in compensation and health care costs. Actual results that differ from our assumptions are accumulated and amortized over future periods and, therefore, generally affect our recognized expense and recorded obligation in future periods. While we believe that our assumptions are appropriate, significant differences in our actual experience or significant changes in our assumptions, including the discount rate used and the expected return on plan assets, may materially affect our pension and other post-retirement obligations and our future expense. Note 15 to the Consolidated Financial Statements discusses the effect of a 1% change in the assumed health care cost trend rate on other post-retirement benefit costs and the related liability.
The objective of our discount rate assumptions was intended to reflect the ratesmeeting at which the pension benefits couldProxy Access Nominee will be effectively settled.nominated, regardless of whether any such filing is required pursuant to the proxy rules of the Securities and Exchange Commission or whether any exemption from filing is available for such solicitation pursuant to the proxy rules of the SEC, and (4) comply with all other applicable laws, rules, regulations and listing standards with respect to any solicitation in connection with the meeting.
(i) The Eligible Shareholder may with its Proxy Access Nomination Notice, provide to the secretary of the Company, a written statement for inclusion in the Company’s proxy statement for the annual meeting of shareholders, not to exceed 500 words per Proxy Access Nominee, in support of each Proxy Access Nominee it names in its Notice (the “Statement”). Notwithstanding anything to the contrary contained in this Section 2(B)(3), the Company may omit from its proxy statement any information or Statement that it believes would violate any applicable law, rule, regulation, or listing standard.
(j) In makingthe event that any information or communications provided by the Eligible Shareholder or Proxy Access Nominee to the Company or its shareholders ceases to be true and correct in any respect or omits a fact necessary to make the statements made, in light of the circumstances under which they were made, not misleading, each Eligible Shareholder or Proxy Access Nominee, as the case may be, shall promptly notify the secretary of the Company of any such inaccuracy or omission in such previously provided information and of the information that is required to make such information or communication true and correct.
(k) The Company shall not be required to include pursuant to this determination, we take into accountSection 2(B)(3), any Proxy Access Nominee in its proxy materials (or, if the timing and amountproxy materials have already been filed, to allow the nomination of benefitsa Proxy Access Nominee, notwithstanding that would be availableproxies in respect of such vote may have been received by the Company) if (i) the Eligible Shareholder has or is engaged in, or has been or is a “participant” in another person’s, “solicitation” within the meaning of Rule14a-1(l) under the plans. Our methodology for selectingExchange Act in support of the discount rates waselection of any individual as a director at the annual meeting of shareholders other than its Proxy Access Nominee(s) or any other nominee of the Board of directors, (ii) the Proxy Access Nominee is determined by the Board of directors not to matchbe independent under the plan’s cash flowsIndependence Standards, (iii) the Proxy Access Nominee’s election as a director would cause the Company to thatbe in violation of these Regulations, the Company’s certificate of incorporation, the Board Qualifications, the listing standards of the principal exchange upon which the Company’s shares are traded, or any applicable state or federal law, rule or regulation, (iv) the Proxy Access Nominee is or becomes a party to any undisclosed Voting Commitment or Compensation Arrangement, (v) the Proxy Access Nominee is or has been, within the past three years, an officer or director of a hypothetical bond portfolio whose cash flow from coupons and maturities match the plan’s projected benefit cash flows. The discount rates are the single rates that produce the same present value of cash flows. The selectioncompetitor, as defined in Section 8 of the 4.62% and 4.44% discount rates asClayton Antitrust Act of year-end 2015 for pension1914, (vi) the Proxy Access Nominee is a named subject of a pending criminal proceeding (excluding traffic violations and other benefits, respectively, representsminor offenses) or has been convicted in such a criminal proceeding within the hypothetical bond portfolio using bonds withpast ten years, (vii) the Proxy Access Nominee is subject to any order of the type specified in Rule 506(d) of Regulation D under the Securities Act, or (viii) the Proxy Access Nominee or the applicable Eligible Shareholder shall have provided information to the Company in respect of such nomination that was untrue in any material respect or omitted to state a material fact necessary in order to make the statement made, in light of the circumstances under which they were made, not misleading or shall have breached its or their agreements, representations, undertakings, and/or obligations pursuant to this Section 2(B)(3).
(l) Notwithstanding anything to the contrary set forth herein, if (a) the Proxy Access Nominee and/or the applicable Eligible Shareholder shall have breached its or their agreements, representations, undertakings and/or obligations pursuant to this Section 2(B)(3), as determined by the Board of directors or the person presiding at the meeting, or (b) the Eligible Shareholder (or a qualified representative thereof) does not appear at the meeting to present any nomination pursuant to this Section 2(B)(3), the Board of directors or the person presiding at the meeting shall be entitled to
77
declare a nomination by an AAEligible Shareholder to be invalid, and such nomination shall be disregarded notwithstanding that proxies in respect of such vote may have been received by the Company and the Company shall not be required to include in its proxy statement any successor or better rating constructed withreplacement nominee proposed by the assistance of an outside consultant. We utilized a discount rate of 3.87% and 3.74% as of year-end 2014 for pension andapplicable Eligible Shareholder or any other benefits, respectively. A 100 basis point increaseEligible Shareholder.
(m) Any Shareholder Nominee who is included in the discount rate would decreaseCompany’s proxy materials for a particular annual meeting of shareholders but either (A) withdraws from or becomes ineligible or unavailable for election at the projected pension benefit obligation asmeeting, or (B) does not receive at least twenty percent of January 30, 2016, by approximately $438 million.
To determine the expected ratevotes cast in favor of return on pension plan assets held by Kroger for 2015, we considered current and forecasted plan asset allocations as well as historical and forecasted rates of return on various asset categories. In 2015, our assumed pension plan investment return rate was 7.44%, comparedthe Proxy Access Nominee’s election, shall be ineligible to 7.44% in 2014 and 8.50 in 2013. Our pension plans’ average rate of return was 6.47%be a Proxy Access Nominee pursuant to this Section 2(B)(3) for the 10 calendar years ended December 31, 2015, netnext two annual meetings of all investment management fees and expenses. The value of all investments in our Company-sponsored defined benefit pension plans duringshareholders following the calendar year ending December 31, 2015, net of investment management fees and expenses, decreased 0.80%. Formeeting for which the past 20 years, our average annual rate of returnShareholder Nominee has been 7.99%. Based onnominated for election.
(n) This Section 2(B)(3) provides the above information and forward looking assumptionsexclusive method for investments made in a manner consistent with our target allocations, we believe a 7.44% rate of return assumption is reasonableshareholders to include nominees for 2015. See Note 15 to the Consolidated Financial Statements for more information on the asset allocations of pension plan assets.
On January 31, 2015, we adopted new mortality tables, including industry-based tables for annuitants, reflecting more current mortality experience and assumptions for future generational mortality improvement in calculating our projected benefit obligations as of January 30, 2016 and January 31, 2015 and our 2015 pension expense. The tables assume an improvement in life expectancy and increased our benefit obligation and future expenses. We used the RP-2000 projected to 2021 mortality table in calculating our 2013 year end pension obligation and 2014 and 2013 pension expense.
A-19
Sensitivity to changesdirector in the major assumptions used in the calculationCompany’s proxy materials with respect to an annual meeting of Kroger’s pension plan liabilities is illustrated below (in millions).shareholders.
78
| |||||||
CINCINNATI, OH 45202 | VOTE BY INTERNET -www.proxyvote.com Use the Internet to transmit your voting instructions and for electronic delivery of information up until 11:59 P.M. Eastern Time the day before the meeting date. Have your proxy card in hand when you access the web site and follow the instructions to obtain your records and to create an electronic voting instruction form. ELECTRONIC DELIVERY OF FUTURE PROXY MATERIALS If you would like to reduce the costs incurred by our company in mailing proxy materials, you can consent to receiving all future proxy statements, proxy cards and annual reports electronically via VOTE BY PHONE -1-800-690-6903 | ||||||
In 2015, we contributed $5 million to our Company-sponsored defined benefit plans and do not expect to make any contributions to these plans in 2016. In 2014, we did not contribute to our Company-sponsored defined benefit plans and do not expect to make any contributions to this plan in 2015. We did not make a contribution in 2014 and contributed $100 million in 2013 to our Company-sponsored defined benefit pension plans. Among other things, investment performance of plan assets, the interest rates required to be used to calculate the pension obligations, and future changes in legislation, will determine the amounts of contributions.
We contributed and expensed $196 million in 2015, $177 million in 2014 and $148 million in 2013 to employee 401(k) retirement savings accounts. The increase in 2015, compared to 2014, is due to a higher employee savings rate. The increase in 2014, compared to 2013, is due to the effect of our merger with Harris Teeter. The 401(k) retirement savings account plans provide to eligible employees both matching contributions and automatic contributions from the Company based on participant contributions, plan compensation, and length of service.
Multi-Employer Pension Plans
We contribute to various multi-employer pension plans, including the UFCW Consolidated Pension Plan, based on obligations arising from collective bargaining agreements. We are designated as the named fiduciary of the UFCW Consolidated Pension Plan and have sole investment authority over these assets. These multi-employer pension plans provide retirement benefits to participants based on their service to contributing employers. The benefits are paid from assets held in trust for that purpose. Trustees are appointed in equal number by employers and unions. The trustees typically are responsible for determining the level of benefits to be provided to participants as well as for such matters as the investment of the assets and the administration of the plans.
In 2015, we contributed $190 million to the UFCW Consolidated Pension Plan. We had previously accrued $60 million of the total contributions at January 31, 2015 and recorded expense for the remaining $130 million at the time of payment in 2015. In 2014, we incurred a charge of $56 million (after-tax) related to commitments and withdrawal liabilities associated with the restructuring of pension plan agreements, of which $15 million was contributed to the UFCW Consolidated Pension Plan in 2014. As of January 30, 2016, we are not required to contribute to the UFCW Consolidated Pension Plan in 2016.
We recognize expense in connection with these plans as contributions are funded or when commitments are made, in accordance with GAAP. We made cash contributions to these plans of $426 million in 2015, $297 million in 2014 and $228 million in 2013.
Based on the most recent information available to us, we believe that the present value of actuarially accrued liabilities in most of the multi-employer plans to which we contribute substantially exceeds the value of the assets held in trust to pay benefits. We have attempted to estimate the amount by which these liabilities exceed the assets, (i.e., the amount of underfunding), as of December 31, 2015. Because we are only one of a number of employers contributing to these plans, we also have attempted to estimate the ratio of our contributions to the total of all contributions to these plans in a year as a way of assessing our “share” of the underfunding. Nonetheless, the underfunding is not a direct obligation or liability of ours or of any employer. As of December 31, 2015, we estimate that our share of the underfunding of multi-employer plans to which we contribute was approximately $2.9 billion, pre-tax, or
A-20
$1.8 billion, after-tax, which includes Roundy’s share of underfunding of its multi-employer plans. This represents an increase in the estimated amount of underfunding of approximately $1.1 billion, pre-tax, or approximately $680 million, after-tax, as of December 31, 2015, compared to December 31, 2014. The increase in the amount of underfunding is attributable to lower than expected returns on the assets held in the multi-employer plans during 2015, changes in mortality rate assumptions and the merger of Roundy’s. Our estimate is based on the most current information available to us including actuarial evaluations and other data (that include the estimates of others), and such information may be outdated or otherwise unreliable.
We have made and disclosed this estimate not because, except as noted above, this underfunding is a direct liability of ours. Rather, we believe the underfunding is likely to have important consequences. In 2016, we expect to contribute approximately $260 million to multi-employer pension plans, subject to collective bargaining and capital market conditions. We expect increases in expense as a result of increases in multi-employer pension plan contributions over the next few years. Finally, underfunding means that, in the event we were to exit certain markets or otherwise cease making contributions to these funds, we could trigger a substantial withdrawal liability. Any adjustment for withdrawal liability will be recorded
Use any touch-tone telephone to transmit your voting instructions up until 11:59 P.M. Eastern Time the day before the meeting date. Have your proxy card in hand when you call and then follow the instructions.
VOTE BY MAIL
Mark, sign and date your proxy card and return it is probable that a liability exists and can be reasonably estimated, in accordance with GAAP.
The amount of underfunding described above is an estimate and could change based on contract negotiations, returns on the assets held in the multi-employer plans and benefit payments. The amount could decline, and our future expense would be favorably affected, if the values of the assets held in the trust significantly increase or if further changes occur through collective bargaining, trustee action or favorable legislation. On the other hand, our share of the underfunding could increase and our future expense could be adversely affected if the asset values decline, if employers currently contributing to these funds cease participation or if changes occur through collective bargaining, trustee action or adverse legislation. We continue to evaluate our potential exposure to under-funded multi-employer pension plans. Although these liabilities are not a direct obligation or liability of ours, any commitments to fund certain multi-employer plans will be expensed when our commitment is probable and an estimate can be made.
See Note 16 to the Consolidated Financial Statements for more information relating to our participation in these multi-employer pension plans.
Uncertain Tax Positions
We review the tax positions taken or expected to be taken on tax returns to determine whether and to what extent a benefit can be recognized in our Consolidated Financial Statements. Refer to Note 5 to the Consolidated Financial Statements for the amount of unrecognized tax benefits and other disclosures related to uncertain tax positions.
Various taxing authorities periodically audit our income tax returns. These audits include questions regarding our tax filing positions, including the timing and amount of deductions and the allocation of income to various tax jurisdictions. In evaluating the exposures connected with these various tax filing positions, including state and local taxes, we record allowances for probable exposures. A number of years may elapse before a particular matter, for which an allowance has been established, is audited and fully resolved. As of January 30, 2016, the Internal Revenue Service had concluded its examination of our 2010 and 2011 federal tax returns. Tax years 2012 and 2013 remain under examination.
The assessment of our tax position relies on the judgment of management to estimate the exposures associated with our various filing positions.
Share-Based Compensation Expense
We account for stock options under the fair value recognition provisions of GAAP. Under this method, we recognize compensation expense for all share-based payments granted. We recognize share-based compensation expense, net of an estimated forfeiture rate, over the requisite service period of the award. In addition, we record expense for restricted stock awards in an amount equal to the fair market value of the underlying stock on the grant date of the award, over the period the award restrictions lapse.
A-21
Inventories
Inventories are stated at the lower of cost (principally on a LIFO basis) or market. In total, approximately 95% of inventories in 2015 and 2014 were valued using the LIFO method. Cost for the balance of the inventories, including substantially all fuel inventories, was determined using the FIFO method. Replacement cost was higher than the carrying amount by $1.3 billion at January 30, 2016 and January 31, 2015. We follow the Link-Chain, Dollar-Value LIFO method for purposes of calculating our LIFO charge or credit.
We follow the item-cost method of accounting to determine inventory cost before the LIFO adjustment for substantially all store inventories at our supermarket divisions. This method involves counting each item in inventory, assigning costs to each of these items based on the actual purchase costs (net of vendor allowances and cash discounts) of each item and recording the cost of items sold. The item-cost method of accounting allows for more accurate reporting of periodic inventory balances and enables management to more precisely manage inventory. In addition, substantially all of our inventory consists of finished goods and is recorded at actual purchase costs (net of vendor allowances and cash discounts).
We evaluate inventory shortages throughout the year based on actual physical counts in our facilities. We record allowances for inventory shortages based on the results of recent physical counts to provide for estimated shortages from the last physical count to the financial statement date.
Vendor Allowances
We recognize all vendor allowances as a reduction in merchandise costs when the related product is sold. In most cases, vendor allowances are applied to the related product cost by item, and therefore reduce the carrying value of inventory by item. When it is not practicable to allocate vendor allowances to the product by item, we recognize vendor allowances as a reduction in merchandise costs based on inventory turns and as the product is sold. We recognized approximately $7.3 billion in 2015, $6.9 billion in 2014 and $6.2 billion in 2013 of vendor allowances as a reduction in merchandise costs. We recognized approximately 91% of all vendor allowances in the item cost with the remainder being based on inventory turns.
RECENTLY ADOPTED ACCOUNTING STANDARDS
In 2015, the Financial Accounting Standards Board (“FASB”) amended Accounting Standards Codification 835, “Interest-Imputation of Interest.” The amendment simplifies the presentation of debt issuance costs related to a recognized debt liability by requiring it be presented in the balance sheet as a direct deduction from the carrying amount of that debt liability, consistent with debt discounts. This amendment became effective beginning February 1, 2015, and was adopted retrospectively in accordance with the standard. The adoption of this amendment resulted in amounts previously reported in other assets to now be reported within long-term debt including obligations under capital leases and financing obligations in the Consolidated Balance Sheets. These amounts were not material to the prior year. The adoption of this amendment did not have an effect on our Consolidated Statements of Operations.
RECENTLY ISSUED ACCOUNTING STANDARDS
In May 2014, the FASB issued Accounting Standards Update (“ASU”) 2014-09, “Revenue from Contracts with Customers,” which provides guidance for revenue recognition. The standard’s core principle is that a company will recognize revenue when it transfers promised goods or services to customers in an amount that reflects the consideration to which the company expects to be entitled in exchange for those goods or services. Per ASU 2015-14, “Deferral of Effective Date,” this guidance will be effective for us in the first quarter of our fiscal year ending February 2, 2019. Early adoption is permitted as of the first quarter of our fiscal year ending February 3, 2018. We are currently in the process of evaluating the effect of adoption of this ASU on our Consolidated Financial Statements.
A-22
In April 2015, the FASB issued ASU 2015-04, “Retirement Benefits (Topic 715): Practical Expedient for the Measurement Date of an Employer’s Defined Benefit Obligation and Plan Assets.” This amendment permits an entity to measure defined benefit plan assets and obligations using the month end that is closest to the entity’s fiscal year end for all plans. This guidance will be effective for us in the fiscal year ending January 28, 2017. The implementation of this amendment will not have an effect on our Consolidated Statements of Operations, and will not have a significant effect on our Consolidated Balance Sheets.
In April 2015, the FASB issued ASU 2015-07, “Fair Value Measurement (Topic 820): Disclosures for Investments in Certain Entities That Calculate Net Asset Value per Share (or Its Equivalent).” This amendment removes the requirement to categorize within the fair value hierarchy all investments for which fair value is measured using the net asset value per share. This guidance will be effective for us in the fiscal year ending January 28, 2017. The implementation of this amendment will have an effect on our Notes to the Consolidated Financial Statements and will not have an effect on our Consolidated Statements of Operations or Consolidated Balance Sheets.
In September 2015, the FASB issued ASU 2015-16, “Business Combinations (Topic 805): Simplifying the Accounting for Measurement-Period Adjustments.” This amendment eliminates the requirement to retrospectively account for adjustments made to provisional amounts recognized in a business combination. This guidance will be effective for us in the fiscal year ending January 28, 2017. The implementation of this amendment is not expected to have a significant effect on our Consolidated Financial Statements.
In November 2015, the FASB issued ASU 2015-17, “Income Taxes (Topic 740): Balance Sheet Classification of Deferred Taxes.” This amendment requires deferred tax liabilities and assets be classified as noncurrent in a classified statement of financial position. This guidance will be effective for our fiscal year ending January 28, 2017. Early adoption is permitted. The implementation of this amendment will not have an effect on our Consolidated Statements of Operations and will not have a significant effect on our Consolidated Balance Sheets.
In February 2016, the FASB issued ASU 2016-02, “Leases”, which provides guidance for the recognition of lease agreements. The standard’s core principle is that a company will now recognize most leases on its balance sheet as lease liabilities with corresponding right-of-use assets. This guidance will be effective for us in the first quarter of fiscal year ending February 1, 2020. Early adoption is permitted. The adoption of this ASU will result in a significant increase to our Consolidated Balance Sheets for lease liabilities and right-of-use assets, and we are currently evaluating the other effects of adoption of this ASU on our Consolidated Financial Statements. We believe our current off-balance sheet leasing commitments are reflected in our investment grade debt rating.
LIQUIDITY AND CAPITAL RESOURCES
Cash Flow Information
Net cash provided by operating activities
We generated $4.8 billion of cash from operations in 2015, compared to $4.2 billion in 2014 and $3.6 billion in 2013. The cash provided by operating activities came from net earnings including non-controlling interests adjusted primarily for non-cash expenses of depreciation and amortization, stock compensation, expense for Company-sponsored pension plans, the LIFO charge and changes in working capital.
The increase in net cash provided by operating activities in 2015, compared to 2014, resulted primarily due to an increase in net earnings including non-controlling interests, an increase in non-cash items and changes in working capital. The increase in non-cash items in 2015, as compared to 2014, was primarily due to increases in depreciation and amortization expense and expense for Company-sponsored pension plans, partially offset by a lower LIFO charge.
A-23
The increase in net cash provided by operating activities in 2014, compared to 2013, resulted primarily due to an increase in net earnings including non-controlling interests, which include the results of Harris Teeter, an increase in non-cash items, a reduction in contributions to Company-sponsored pension plans and changes in working capital. The increase in non-cash items in 2014, as compared to 2013, was primarily due to increases in depreciation and amortization expense and the LIFO charge. The amount of cash paid for income taxes increased in 2014, compared to 2013, primarily due to an increase in net earnings including non-controlling interests.
Cash provided (used) by operating activities for changes in working capital was $96 million in 2015, compared to ($49) million in 2014 and $63 million in 2013. The increase in cash provided by operating activities for changes in working capital in 2015, compared to 2014, was primarily due to an increase in cash provided by trade accounts payables and store deposits in transit, partially offset by a decrease in cash provided by income taxes receivable and payable. The increase in cash used by operating activities for changes in working capital in 2014, compared to 2013, was primarily due to an increase in cash used for receivables and a decrease in cash provided by trade accounts payables, partially offset by an increase in cash provided by accrued expenses.
Net cash used by investing activities
Cash used by investing activities was $3.6 billion in 2015, compared to $3.1 billion in 2014 and $4.8 billion in 2013. The amount of cash used by investing activities increased in 2015, compared to 2014, due to increased payments for capital investments, partially offset by lower payments for mergers. The amount of cash used by investing activities decreased in 2014, compared to 2013, due to decreased payments for mergers, offset primarily by increased payments for capital investments. Capital investments, including payments for lease buyouts, but excluding mergers, were $3.3 billion in 2015, $2.8 billion in 2014 and $2.3 billion in 2013. Merger payments were $168 million in 2015, $252 million in 2014 and $2.3 billion in 2013. Merger payments decreased in 2014, compared to 2013, primarily due to our merger with Harris Teeter in 2013. Refer to the “Capital Investments” section for an overview of our supermarket storing activity during the last three years.
Net cash provided (used) by financing activities
Financing activities (used) provided cash of ($1.3) billion in 2015, ($1.2) billion in 2014 and $1.4 billion in 2013. The increase in the amount of cash used for financing activities in 2015, compared to 2014, was primarily related to increased payments on long-term debt and commercial paper, partially offset by higher proceeds from issuances of long-term debt and decreased treasury stock purchases. The increase in the amount of cash used for financing activities in 2014, compared to 2013, was primarily related to decreased proceeds from the issuance of long-term debt and increased treasury stock purchases, offset partially by decreased payments on long-term debt. Proceeds from the issuance of long-term debt were $1.2 billion in 2015, $576 million in 2014 and $3.5 billion in 2013. Net (payments) borrowings provided from our commercial paper program were ($285) million in 2015, $25 million in 2014 and ($395) million in 2013. Please refer to the “Debt Management” section of MD&A for additional information. We repurchased $703 million of Kroger common shares in 2015, compared to $1.3 billion in 2014 and $609 million in 2013. We paid dividends totaling $385 million in 2015, $338 million in 2014 and $319 million in 2013.
Debt Management
Total debt, including both the current and long-term portions of capital lease and lease-financing obligations, increased $481 million to $12.1 billion as of year-end 2015, compared to 2014. The increase in 2015, compared to 2014, resulted primarily from the issuance of (i) $300 million of senior notes bearing an interest rate of 2.00%, (ii) $300 million of senior notes bearing an interest rate of 2.60%, (iii) $500 million of senior notes bearing an interest rate of 3.50% and (iv) an increase in capital lease obligations due to our merger with Roundy’s and various leased locations, partially offset by payments of $678 million on long-term debt obligations assumed as part of our merger with Roundy’s and $500 million of payments at maturity of senior notes bearing an interest rate of 3.90%. The increase in financing obligations was due to partially funding our merger with Roundy’s.
A-24
Total debt, including both the current and long-term portions of capital lease and lease-financing obligations increased $346 million to $11.7 billion as of year-end 2014, compared to 2013. The increase in 2014, compared to 2013, resulted primarily from (i) the issuance of $500 million of senior notes bearing an interest rate of 2.95% and (ii) an increase in commercial paper of $25 million, partially offset by payments at maturity of $300 million of senior notes bearing an interest rate of 4.95%. The increase in financing obligations was due to partially funding our outstanding common share repurchases.
Liquidity Needs
We estimate our liquidity needs over the next twelve-month period to range from $6.6 to $6.9 billion, which includes anticipated requirements for working capital, capital investments, interest payments and scheduled principal payments of debt and commercial paper, offset by cash and temporary cash investments on hand at the end of 2015. We generally operate with a working capital deficit due to our efficient use of cash in funding operations and because we have consistent access to the capital markets. Based on current operating trends, we believe that cash flows from operating activities and other sources of liquidity, including borrowings under our commercial paper program and bank credit facility, will be adequate to meet our liquidity needs for the next twelve months and for the foreseeable future beyond the next twelve months. We have approximately $990 million of commercial paper and $1.3 billion of senior notes maturing in the next twelve months, which is included in the range of $6.6 to $6.9 billion in estimated liquidity needs. We expect to refinance this debt, in 2016, by issuing additional senior notes or commercial paper on favorable terms based on our past experience. We also currently plan to continue repurchases of common shares under the Company’s share repurchase programs. We believe we have adequate coverage of our debt covenants to continue to maintain our current debt ratings and to respond effectively to competitive conditions.
Factors Affecting Liquidity
We can currently borrow on a daily basis approximately $2.75 billion under our commercial paper (“CP”) program. At January 30, 2016, we had $990 million of CP borrowings outstanding. CP borrowings are backed by our credit facility, and reduce the amount we can borrow under the credit facility. If our short-term credit ratings fall, the ability to borrow under our current CP program could be adversely affected for a period of time and increase our interest cost on daily borrowings under our CP program. This could require us to borrow additional funds under the credit facility, under which we believe we have sufficient capacity. However, in the event of a ratings decline, we do not anticipate that our borrowing capacity under our CP program would be any lower than $500 million on a daily basis. Although our ability to borrow under the credit facility is not affected by our credit rating, the interest cost on borrowings under the credit facility could be affected by an increase in our Leverage Ratio. As of March 23, 2016, we had $1.1 billion of CP borrowings outstanding. The increase as of March 23, 2016, compared to year-end 2015, was due to partially funding our outstanding common share repurchases.
Our credit facility requires the maintenance of a Leverage Ratio and a Fixed Charge Coverage Ratio (our “financial covenants”). A failure to maintain our financial covenants would impair our ability to borrow under the credit facility. These financial covenants and ratios are described below:
| |
|
Our credit agreement is more fully described in Note 6 to the Consolidated Financial Statements. We were in compliance with our financial covenants at year-end 2015.
A-25
The tables below illustrate our significant contractual obligations and other commercial commitments, based on year of maturity or settlement, as of January 30, 2016 (in millions of dollars):
| 2016 | 2017 | 2018 | 2019 | 2020 | Thereafter | Total | ||||||||||||||||
| Contractual Obligations(1) (2) | ||||||||||||||||||||||
| Long-term debt(3) | $ | 2,318 | $ | 735 | $ | 1,307 | $ | 774 | $ | 724 | $ | 5,538 | $ | 11,396 | ||||||||
| Interest on long-term debt(4) | 476 | 410 | 375 | 315 | 279 | 2,550 | 4,405 | |||||||||||||||
| Capital lease obligations | 103 | 72 | 62 | 57 | 52 | 527 | 873 | |||||||||||||||
| Operating lease obligations | 967 | 922 | 853 | 774 | 674 | 4,199 | 8,389 | |||||||||||||||
| Financed lease obligations | 13 | 13 | 13 | 13 | 13 | 74 | 139 | |||||||||||||||
| Self-insurance liability(5) | 223 | 138 | 98 | 63 | 38 | 79 | 639 | |||||||||||||||
| Construction commitments(6) | 418 | — | — | — | — | — | 418 | |||||||||||||||
| Purchase obligations(7) | 532 | 161 | 77 | 58 | 42 | 106 | 976 | |||||||||||||||
| Total | $ | 5,050 | $ | 2,451 | $ | 2,786 | $ | 2,054 | $ | 1,822 | $ | 13,072 | $ | 27,235 | ||||||||
| Other Commercial Commitments | ||||||||||||||||||||||
| Standby letters of credit | $ | 244 | $ | — | $ | — | $ | — | $ | — | $ | — | $ | 244 | ||||||||
| Surety bonds | 332 | — | — | — | — | — | 332 | |||||||||||||||
| Total | $ | 576 | $ | — | $ | — | $ | — | $ | — | $ | — | $ | 576 | ||||||||
As of January 30, 2016, we maintained a $2.75 billion (with the ability to increase by $750 million), unsecured revolving credit facility that, unless extended, terminates on June 30, 2019. Outstanding borrowings under the credit agreement and commercial paper borrowings, and some outstanding letters of credit, reduce funds available under the credit agreement. As of January 30, 2016, we had $990 million of borrowings of commercial paper and no borrowings under our credit agreement. The outstanding letters of credit that reduce funds available under our credit agreement totaled $13 million as of January 30, 2016.
A-26
In addition to the available credit mentioned above, as of January 30, 2016, we had authorized for issuance $900 million of securities under a shelf registration statement filed with the SEC and effective on December 13, 2013.
We also maintain surety bonds related primarily to our self-insured workers’ compensation claims. These bonds are required by most states in which we are self-insured for workers’ compensation and are placed with predominately third-party insurance providers to insure payment of our obligations in the event we are unable to meet our claim payment obligations up to our self-insured retention levels. These bonds do not represent liabilities of ours, as we already have reserves on our books for the claims costs. Market changes may make the surety bonds more costly and, in some instances, availability of these bonds may become more limited, which could affect our costs of, or access to, such bonds. Although we do not believe increased costs or decreased availability would significantly affect our ability to access these surety bonds, if this does become an issue, we would issue letters of credit, in states where allowed, against our credit facility to meet the state bonding requirements. This could increase our cost and decrease the funds available under our credit facility.
We also are contingently liable for leases that have been assigned to various third parties in connection with facility closings and dispositions. We could be required to satisfy obligations under the leases if any of the assignees are unable to fulfill their lease obligations. Due to the wide distribution of our assignments among third parties, and various other remedies available to us, we believe the likelihood that we will be required to assume a material amount of these obligations is remote. We have agreed to indemnify certain third-party logistics operators for certain expenses, including pension trust fund contribution obligations and withdrawal liabilities.
In addition to the above, we enter into various indemnification agreements and take on indemnification obligations in the ordinary course of business. Such arrangements include indemnities against third party claims arising out of agreements to provide services to us; indemnities related to the sale of our securities; indemnities of directors, officers and employees in connection with the performance of their work; and indemnities of individuals serving as fiduciaries on benefit plans. While our aggregate indemnification obligation could result in a material liability, we are not aware of any current matter that could result in a material liability.
OUTLOOK
This discussion and analysis contains certain forward-looking statements about our future performance. These statements are based on management’s assumptions and beliefs in light of the information currently available to it. Such statements are indicated by words such as “comfortable,” “committed,” “will,” “expect,” “goal,” “should,” “intend,” “target,” “believe,” “anticipate,” “plan,” and similar words or phrases. These forward-looking statements are subject to uncertainties and other factors that could cause actual results to differ materially.
Statements elsewhere in this report and below regarding our expectations, projections, beliefs, intentions or strategies are forward-looking statements within the meaning of Section 21E of the Securities Exchange Act of 1934. While we believe that the statements are accurate, uncertainties about the general economy, our labor relations, our ability to execute our plans on a timely basis and other uncertainties described below could cause actual results to differ materially. The guidance below includes our expectations for Roundy’s.
| |
| |
|
A-27
| |
| |
| |
| |
| |
| |
| |
|
Various uncertainties and other factors could cause actual results to differ materially from those contained in the forward-looking statements. These include:
| |
|
A-28
| |
| |
| |
|
We cannot fully foresee the effects of changes in economic conditions on Kroger’s business. We have assumed economic and competitive situations will not change significantly in 2016.
Other factors and assumptions not identified above could also cause actual results to differ materially from those set forth in the forward-looking information. Accordingly, actual events and results may vary significantly from those included in, contemplated or implied by forward-looking statements made by us or our representatives. We undertake no obligation to update the forward-looking information contained in this filing.
A-29
REPORTOF INDEPENDENT REGISTERED PUBLIC ACCOUNTING FIRM
To the Shareholders and Board of Directors ofThe Kroger Co.
In our opinion, the accompanying consolidated balance sheets and the related consolidated statements of operations, comprehensive income, cash flows and changes in shareholders’ equitypresent fairly, in all material respects, the financial position of The Kroger Co. and its subsidiariesat January 30, 2016 and January 31, 2015, and the results of their operations and their cash flows for each of the three years in the period ended January 30, 2016in conformity with accounting principles generally accepted in the United States of America. Also in our opinion, the Company maintained, in all material respects, effective internal control over financial reporting as of January 30, 2016, based on criteria established inInternal Control - Integrated Framework (2013) issued by the Committee of Sponsoring Organizations of the Treadway Commission (COSO). The Company’s management is responsible for these financial statements, for maintaining effective internal control over financial reporting and for its assessment of the effectiveness of internal control over financial reporting, included in Management’s Report on Internal Control over Financial Reporting appearing on page A-1. Our responsibility is to express opinions on these financial statements and on the Company’s internal control over financial reporting based on our integrated audits. We conducted our audits in accordance with the standards of the Public Company Accounting Oversight Board (United States). Those standards require that we plan and perform the audits to obtain reasonable assurance about whether the financial statements are free of material misstatement and whether effective internal control over financial reporting was maintained in all material respects. Our audits of the financial statements included examining, on a test basis, evidence supporting the amounts and disclosures in the financial statements, assessing the accounting principles used and significant estimates made by management, and evaluating the overall financial statement presentation. Our audit of internal control over financial reporting included obtaining an understanding of internal control over financial reporting, assessing the risk that a material weakness exists, and testing and evaluating the design and operating effectiveness of internal control based on the assessed risk. Our audits also included performing such other procedures as we considered necessary in the circumstances. We believe that our audits provide a reasonable basis for our opinions.
A company’s internal control over financial reporting is a process designed to provide reasonable assurance regarding the reliability of financial reporting and the preparation of financial statements for external purposes in accordance with generally accepted accounting principles. A company’s internal control over financial reporting includes those policies and procedures that (i) pertain to the maintenance of records that, in reasonable detail, accurately and fairly reflect the transactions and dispositions of the assets of the company; (ii) provide reasonable assurance that transactions are recorded as necessary to permit preparation of financial statements in accordance with generally accepted accounting principles, and that receipts and expenditures of the company are being made only in accordance with authorizations of management and directors of the company; and (iii) provide reasonable assurance regarding prevention or timely detection of unauthorized acquisition, use, or disposition of the company’s assets that could have a material effect on the financial statements.
Because of its inherent limitations, internal control over financial reporting may not prevent or detect misstatements. Also, projections of any evaluation of effectiveness to future periods are subject to the risk that controls may become inadequate because of changes in conditions, or that the degree of compliance with the policies or procedures may deteriorate.
As described in Management’s Report on Internal Control Over Financial Reporting, management has excluded Roundy’s, Inc. from its assessment of internal control over financial reporting as of January 30, 2016 because it was acquired by the Company in a purchase business combination on December 18, 2015. We have also excluded Roundy’s, Inc. from our audit of internal control over financial reporting. Roundy’s, Inc. is a wholly-owned subsidiary whose total assets and total revenues represent 2% and less than 1%, respectively, of the related consolidated financial statement amounts as of and for the year ended January 30, 2016.
A-30
THE KROGER CO.
CONSOLIDATED BALANCE SHEETS
| (In millions, except par values) | January 30, 2016 | January 31, 2015 | ||||||||||
| ASSETS | ||||||||||||
| Current assets | ||||||||||||
| Cash and temporary cash investments | $ | 277 | $ | 268 | ||||||||
| Store deposits in-transit | 923 | 988 | ||||||||||
| Receivables | 1,734 | 1,266 | ||||||||||
| FIFO inventory | 7,440 | 6,933 | ||||||||||
| LIFO reserve | (1,272 | ) | (1,245 | ) | ||||||||
| Prepaid and other current assets | 790 | 701 | ||||||||||
| Total current assets | 9,892 | 8,911 | ||||||||||
| Property, plant and equipment, net | 19,619 | 17,912 | ||||||||||
| Intangibles, net | 1,053 | 757 | ||||||||||
| Goodwill | 2,724 | 2,304 | ||||||||||
| Other assets | 609 | 613 | ||||||||||
| Total Assets | $ | 33,897 | $ | 30,497 | ||||||||
| LIABILITIES | ||||||||||||
| Current liabilities | ||||||||||||
| Current portion of long-term debt including obligations under capital leases and | ||||||||||||
| financing obligations | $ | 2,370 | $ | 1,874 | ||||||||
| Trade accounts payable | 5,728 | 5,052 | ||||||||||
| Accrued salaries and wages | 1,426 | 1,291 | ||||||||||
| Deferred income taxes | 221 | 287 | ||||||||||
| Other current liabilities | 3,226 | 2,888 | ||||||||||
| Total current liabilities | 12,971 | 11,392 | ||||||||||
| Long-term debt including obligations under capital leases and financing obligations | ||||||||||||
| Face-value of long-term debt including obligations under capital leases and | ||||||||||||
| financing obligations | 9,708 | 9,723 | ||||||||||
| Adjustment to reflect fair-value interest rate hedges | 1 | — | ||||||||||
| Long-term debt including obligations under capital leases and | ||||||||||||
| financing obligations | 9,709 | 9,723 | ||||||||||
| Deferred income taxes | 1,752 | 1,209 | ||||||||||
| Pension and postretirement benefit obligations | 1,380 | 1,463 | ||||||||||
| Other long-term liabilities | 1,287 | 1,268 | ||||||||||
| Total Liabilities | 27,099 | 25,055 | ||||||||||
| Commitments and contingencies (see Note 13) | ||||||||||||
| SHAREHOLDERS’ EQUITY | ||||||||||||
| Preferred shares, $100 par per share, 5 shares authorized and unissued | — | — | ||||||||||
| Common shares, $1 par per share, 2,000 shares authorized; | ||||||||||||
| 1,918 shares issued in 2015 and 2014 | 1,918 | 1,918 | ||||||||||
| Additional paid-in capital | 2,980 | 2,748 | ||||||||||
| Accumulated other comprehensive loss | (680 | ) | (812 | ) | ||||||||
| Accumulated earnings | 14,011 | 12,367 | ||||||||||
| Common stock in treasury, at cost, 951 shares in 2015 and 944 shares in 2014 | (11,409 | ) | (10,809 | ) | ||||||||
| Total Shareholders’ Equity - The Kroger Co. | 6,820 | 5,412 | ||||||||||
| Noncontrolling interests | (22 | ) | 30 | |||||||||
| Total Equity | 6,798 | 5,442 | ||||||||||
| Total Liabilities and Equity | $ | 33,897 | $ | 30,497 | ||||||||
The accompanying notes are an integral part of the consolidated financial statements.
A-31
THE KROGER CO.
CONSOLIDATED STATEMENTSOF OPERATIONS
Years Ended January 30, 2016, January 31, 2015 and February 1, 2014
| (In millions, except per share amounts) | 2015 (52 weeks) | 2014 (52 weeks) | 2013 (52 weeks) | ||||||||||||
| Sales | $ | 109,830 | $ | 108,465 | $ | 98,375 | |||||||||
| Merchandise costs, including advertising, warehousing, and | |||||||||||||||
| transportation, excluding items shown separately below | 85,496 | 85,512 | 78,138 | ||||||||||||
| Operating, general and administrative | 17,946 | 17,161 | 15,196 | ||||||||||||
| Rent | 723 | 707 | 613 | ||||||||||||
| Depreciation and amortization | 2,089 | 1,948 | 1,703 | ||||||||||||
| Operating Profit | 3,576 | 3,137 | 2,725 | ||||||||||||
| Interest expense | 482 | 488 | 443 | ||||||||||||
| Earnings before income tax expense | 3,094 | 2,649 | 2,282 | ||||||||||||
| Income tax expense | 1,045 | 902 | 751 | ||||||||||||
| Net earnings including noncontrolling interests | 2,049 | 1,747 | 1,531 | ||||||||||||
| Net earnings attributable to noncontrolling interests | 10 | 19 | 12 | ||||||||||||
| Net earnings attributable to The Kroger Co. | $ | 2,039 | $ | 1,728 | $ | 1,519 | |||||||||
| Net earnings attributable to The Kroger Co. per basic common share | $ | 2.09 | $ | 1.74 | $ | 1.47 | |||||||||
| Average number of common shares used in basic calculation | 966 | 981 | 1,028 | ||||||||||||
| Net earnings attributable to The Kroger Co. per diluted common share | $ | 2.06 | $ | 1.72 | $ | 1.45 | |||||||||
| Average number of common shares used in diluted calculation | 980 | 993 | 1,040 | ||||||||||||
| Dividends declared per common share | $ | 0.408 | $ | 0.350 | $ | 0.315 | |||||||||
The accompanying notes are an integral part of the consolidated financial statements.
A-32
THE KROGER CO.
CONSOLIDATED STATEMENTSOF COMPREHENSIVE INCOME
Years Ended January 30, 2016, January 31, 2015 and February 1, 2014
| (In millions) | 2015 (52 weeks) | 2014 (52 weeks) | 2013 (52 weeks) | |||||||||||||||
| Net earnings including noncontrolling interests | $ | 2,049 | $ | 1,747 | $ | 1,531 | ||||||||||||
| Other comprehensive income (loss) | ||||||||||||||||||
| Unrealized gain on available for sale securities, net of | ||||||||||||||||||
| income tax(1) | 3 | 5 | 5 | |||||||||||||||
| Change in pension and other postretirement defined benefit plans, | ||||||||||||||||||
| net of income tax(2) | 131 | (329 | ) | 295 | ||||||||||||||
| Unrealized losses on cash flow hedging activities, | ||||||||||||||||||
| net of income tax(3) | (3 | ) | (25 | ) | (12 | ) | ||||||||||||
| Amortization of unrealized gains and losses on cash flow hedging | ||||||||||||||||||
| activities, net of income tax(4) | 1 | 1 | 1 | |||||||||||||||
| Total other comprehensive income (loss) | 132 | (348 | ) | 289 | ||||||||||||||
| Comprehensive income | 2,181 | 1,399 | 1,820 | |||||||||||||||
| Comprehensive income attributable to noncontrolling interests | 10 | 19 | 12 | |||||||||||||||
| Comprehensive income attributable to The Kroger Co. | $ | 2,171 | $ | 1,380 | $ | 1,808 | ||||||||||||
The accompanying notes are an integral part of the consolidated financial statements.
A-33
THE KROGER CO.
CONSOLIDATED STATEMENTS oF CASH FLOWS
Years Ended January 30, 2016, January 31, 2015 and February 1, 2014
| (In millions) | 2015 (52 weeks) | 2014 (52 weeks) | 2013 (52 weeks) | ||||||||||||||
| Cash Flows From Operating Activities: | |||||||||||||||||
| Net earnings including noncontrolling interests | $ | 2,049 | $ | 1,747 | $ | 1,531 | |||||||||||
| Adjustments to reconcile net earnings to net cash provided by operating activities: | |||||||||||||||||
| Depreciation and amortization | 2,089 | 1,948 | 1,703 | ||||||||||||||
| Asset impairment charge | 46 | 37 | 39 | ||||||||||||||
| LIFO charge | 28 | 147 | 52 | ||||||||||||||
| Stock-based employee compensation | 165 | 155 | 107 | ||||||||||||||
| Expense for Company-sponsored pension plans | 103 | 55 | 74 | ||||||||||||||
| Deferred income taxes | 317 | 73 | 72 | ||||||||||||||
| Other | 54 | 72 | 47 | ||||||||||||||
| Changes in operating assets and liabilities net of effects from mergers of businesses: | |||||||||||||||||
| Store deposits in-transit | 95 | (27 | ) | 25 | |||||||||||||
| Receivables | (59 | ) | (141 | ) | (8 | ) | |||||||||||
| Inventories | (184 | ) | (147 | ) | (131 | ) | |||||||||||
| Prepaid and other current assets | (28 | ) | 2 | (49 | ) | ||||||||||||
| Trade accounts payable | 440 | 135 | 196 | ||||||||||||||
| Accrued expenses | 191 | 197 | 77 | ||||||||||||||
| Income taxes receivable and payable | (359 | ) | (68 | ) | (47 | ) | |||||||||||
| Contribution to Company-sponsored pension plans | (5 | ) | — | (100 | ) | ||||||||||||
| Other | (109 | ) | (22 | ) | (15 | ) | |||||||||||
| Net cash provided by operating activities | 4,833 | 4,163 | 3,573 | ||||||||||||||
| Cash Flows From Investing Activities: | |||||||||||||||||
| Payments for property and equipment, including payments for lease buyouts | (3,349 | ) | (2,831 | ) | (2,330 | ) | |||||||||||
| Proceeds from sale of assets | 45 | 37 | 24 | ||||||||||||||
| Payments for mergers | (168 | ) | (252 | ) | (2,344 | ) | |||||||||||
| Other | (98 | ) | (14 | ) | (121 | ) | |||||||||||
| Net cash used by investing activities | (3,570 | ) | (3,060 | ) | (4,771 | ) | |||||||||||
| Cash Flows From Financing Activities: | |||||||||||||||||
| Proceeds from issuance of long-term debt | 1,181 | 576 | 3,548 | ||||||||||||||
| Payments on long-term debt | (1,245 | ) | (375 | ) | (1,060 | ) | |||||||||||
| Net (payments) borrowings on commercial paper | (285 | ) | 25 | (395 | ) | ||||||||||||
| Dividends paid | (385 | ) | (338 | ) | (319 | ) | |||||||||||
| Excess tax benefits on stock based awards | 97 | 52 | 32 | ||||||||||||||
| Proceeds from issuance of capital stock | 120 | 110 | 196 | ||||||||||||||
| Treasury stock purchases | (703 | ) | (1,283 | ) | (609 | ) | |||||||||||
| Investment in the remaining equity of a noncontrolling interest | (26 | ) | — | — | |||||||||||||
| Other | (8 | ) | (3 | ) | (32 | ) | |||||||||||
| Net cash provided (used) by financing activities | (1,254 | ) | (1,236 | ) | 1,361 | ||||||||||||
| Net increase (decrease) in cash and temporary cash investments | 9 | (133 | ) | 163 | |||||||||||||
| Cash and temporary cash investments: | |||||||||||||||||
| Beginning of year | 268 | 401 | 238 | ||||||||||||||
| End of year | $ | 277 | $ | 268 | $ | 401 | |||||||||||
| Reconciliation of capital investments: | |||||||||||||||||
| Payments for property and equipment, including payments for lease buyouts | $ | (3,349 | ) | $ | (2,831 | ) | $ | (2,330 | ) | ||||||||
| Payments for lease buyouts | 35 | 135 | 108 | ||||||||||||||
| Changes in construction-in-progress payables | (35 | ) | (56 | ) | (83 | ) | |||||||||||
| Total capital investments, excluding lease buyouts | $ | (3,349 | ) | $ | (2,752 | ) | $ | (2,305 | ) | ||||||||
| Disclosure of cash flow information: | |||||||||||||||||
| Cash paid during the year for interest | $ | 474 | $ | 477 | $ | 401 | |||||||||||
| Cash paid during the year for income taxes | $ | 1,001 | $ | 941 | $ | 679 | |||||||||||
The accompanying notes are an integral part of the consolidated financial statements.
A-34
THE KROGER CO.
CONSOLIDATED STATEMENTOF CHANGESIN SHAREHOLDERS’ EQUITY
Years Ended January 30, 2016, January 31, 2015 and February 1, 2014
| (In millions, except per share amounts) | Common Stock | Additional Paid-In Capital | Treasury Stock | Accumulated Other Comprehensive Gain (Loss) | Accumulated Earnings | Noncontrolling Interest | Total | |||||||||||||||||||||||||||||||||||||||
| Shares | Amount | Shares | Amount | |||||||||||||||||||||||||||||||||||||||||||
| Balances at February 2, 2013 | 1,918 | $ | 1,918 | $ | 2,492 | 890 | $ | (9,237 | ) | $ | (753 | ) | $ | 9,787 | $ | 7 | $ | 4,214 | ||||||||||||||||||||||||||||
| Issuance of common stock: | ||||||||||||||||||||||||||||||||||||||||||||||
| Stock options exercised | — | — | — | (18 | ) | 196 | — | — | — | 196 | ||||||||||||||||||||||||||||||||||||
| Restricted stock issued | — | — | (60 | ) | (5 | ) | 26 | — | — | — | (34 | ) | ||||||||||||||||||||||||||||||||||
| Treasury stock activity: | ||||||||||||||||||||||||||||||||||||||||||||||
| Treasury stock purchases, at cost | — | — | — | 18 | (338 | ) | — | — | — | (338 | ) | |||||||||||||||||||||||||||||||||||
| Stock options exchanged | — | — | — | 17 | (271 | ) | — | — | — | (271 | ) | |||||||||||||||||||||||||||||||||||
| Share-based employee compensation | — | — | 107 | — | — | — | — | — | 107 | |||||||||||||||||||||||||||||||||||||
| Other comprehensive gain net of | ||||||||||||||||||||||||||||||||||||||||||||||
| income tax of $168 | — | — | — | — | — | 289 | — | — | 289 | |||||||||||||||||||||||||||||||||||||
| Other | — | — | 51 | — | (17 | ) | — | — | (8 | ) | 26 | |||||||||||||||||||||||||||||||||||
| Cash dividends declared | ||||||||||||||||||||||||||||||||||||||||||||||
| ($0.315 per common share) | — | — | — | — | — | — | (325 | ) | — | (325 | ) | |||||||||||||||||||||||||||||||||||
| Net earnings including | ||||||||||||||||||||||||||||||||||||||||||||||
| non-controlling interests | — | — | — | — | — | — | 1,519 | 12 | 1,531 | |||||||||||||||||||||||||||||||||||||
| Balances at February 1, 2014 | 1,918 | $ | 1,918 | $ | 2,590 | 902 | $ | (9,641 | ) | $ | (464 | ) | $ | 10,981 | $ | 11 | $ | 5,395 | ||||||||||||||||||||||||||||
| Issuance of common stock: | ||||||||||||||||||||||||||||||||||||||||||||||
| Stock options exercised | — | — | — | (10 | ) | 110 | — | — | — | 110 | ||||||||||||||||||||||||||||||||||||
| Restricted stock issued | — | — | (91 | ) | (5 | ) | 40 | — | — | — | (51 | ) | ||||||||||||||||||||||||||||||||||
| Treasury stock activity: | ||||||||||||||||||||||||||||||||||||||||||||||
| Treasury stock purchases, at cost | — | — | — | 51 | (1,129 | ) | — | — | — | (1,129 | ) | |||||||||||||||||||||||||||||||||||
| Stock options exchanged | — | — | — | 6 | (154 | ) | — | — | — | (154 | ) | |||||||||||||||||||||||||||||||||||
| Share-based employee compensation | — | — | 155 | — | — | — | — | — | 155 | |||||||||||||||||||||||||||||||||||||
| Other comprehensive loss net of income | ||||||||||||||||||||||||||||||||||||||||||||||
| tax of ($204) | — | — | — | — | — | (348 | ) | — | — | (348 | ) | |||||||||||||||||||||||||||||||||||
| Other | — | — | 94 | — | (35 | ) | — | — | — | 59 | ||||||||||||||||||||||||||||||||||||
| Cash dividends declared | ||||||||||||||||||||||||||||||||||||||||||||||
| ($0.350 per common share) | — | — | — | — | — | — | (342 | ) | — | (342 | ) | |||||||||||||||||||||||||||||||||||
| Net earnings including | ||||||||||||||||||||||||||||||||||||||||||||||
| non-controlling interests | — | — | — | — | — | — | 1,728 | 19 | 1,747 | |||||||||||||||||||||||||||||||||||||
| Balances at January 31, 2015 | 1,918 | $ | 1,918 | $ | 2,748 | 944 | $ | (10,809 | ) | $ | (812 | ) | $ | 12,367 | $ | 30 | $ | 5,442 | ||||||||||||||||||||||||||||
| Issuance of common stock: | ||||||||||||||||||||||||||||||||||||||||||||||
| Stock options exercised | — | — | — | (9 | ) | 120 | — | — | — | 120 | ||||||||||||||||||||||||||||||||||||
| Restricted stock issued | — | — | (122 | ) | (5 | ) | 37 | — | — | — | (85 | ) | ||||||||||||||||||||||||||||||||||
| Treasury stock activity: | ||||||||||||||||||||||||||||||||||||||||||||||
| Treasury stock purchases, at cost | — | — | — | 14 | (500 | ) | — | — | — | (500 | ) | |||||||||||||||||||||||||||||||||||
| Stock options exchanged | — | — | — | 7 | (203 | ) | — | — | — | (203 | ) | |||||||||||||||||||||||||||||||||||
| Share-based employee compensation | — | — | 165 | — | — | — | — | — | 165 | |||||||||||||||||||||||||||||||||||||
| Other comprehensive gain net of income | ||||||||||||||||||||||||||||||||||||||||||||||
| tax of $77 | — | — | — | — | — | 132 | — | — | 132 | |||||||||||||||||||||||||||||||||||||
| Investment in the remaining equity of a | ||||||||||||||||||||||||||||||||||||||||||||||
| non-controlling interest | — | — | 26 | — | — | — | — | (57 | ) | (31 | ) | |||||||||||||||||||||||||||||||||||
| Other | — | — | 163 | — | (54 | ) | — | — | (5 | ) | 104 | |||||||||||||||||||||||||||||||||||
| Cash dividends declared | ||||||||||||||||||||||||||||||||||||||||||||||
| ($0.408 per common share) | — | — | — | — | — | — | (395 | ) | — | (395 | ) | |||||||||||||||||||||||||||||||||||
| Net earnings including | ||||||||||||||||||||||||||||||||||||||||||||||
| non-controlling interests | — | — | — | — | — | — | 2,039 | 10 | 2,049 | |||||||||||||||||||||||||||||||||||||
| Balances at January 30, 2016 | 1,918 | $ | 1,918 | $ | 2,980 | 951 | $ | (11,409 | ) | $ | (680 | ) | $ | 14,011 | $ | (22 | ) | $ | 6,798 | |||||||||||||||||||||||||||
The accompanying notes are an integral part of the consolidated financial statements.
A-35
NOTESTO CONSOLIDATED FINANCIAL STATEMENTS
All amounts in the Notes to Consolidated Financial Statements are in millions except per share amounts.
1. ACCOUNTING POLICIES
The following is a summary of the significant accounting policies followed in preparing these financial statements.
Description of Business, Basis of Presentation and Principles of Consolidation
The Kroger Co. (the “Company”) was founded in 1883 and incorporated in 1902. As of January 30, 2016, the Company was one of the largest retailers in the nation based on annual sales. The Company also manufactures and processes food for sale by its supermarkets. The accompanying financial statements include the consolidated accounts of the Company, its wholly-owned subsidiaries and the variable interest entities in which the Company is the primary beneficiary. Significant intercompany transactions and balances have been eliminated.
On June 25, 2015, the Company’s Board of Directors approved a two-for-one stock split of The Kroger Co.’s common shares in the form of a 100% stock dividend, which was effective July 13, 2015. All share and per share amounts in the Company’s Consolidated Financial Statements and related notes have been retroactively adjusted to reflect the stock split for all periods presented.
Refer to Note 17 for an additional change to the Consolidated Balance Sheets for a recently adopted accounting standard regarding the presentation of debt issuance costs.
Fiscal Year
The Company’s fiscal year ends on the Saturday nearest January 31. The last three fiscal years consist of the 52-week periods ended January 30, 2016, January 31, 2015 and February 1, 2014.
Pervasiveness of Estimates
The preparation of financial statements in conformity with generally accepted accounting principles (“GAAP”) requires management to make estimates and assumptions that affect the reported amounts of assets and liabilities. Disclosure of contingent assets and liabilities as of the date of the consolidated financial statements and the reported amounts of consolidated revenues and expenses during the reporting period is also required. Actual results could differ from those estimates.
Cash, Temporary Cash Investments and Book Overdrafts
Cash and temporary cash investments represent store cash and short-term investments with original maturities of less than three months. Book overdrafts are included in “Trade accounts payable” and “Accrued salaries and wages” in the Consolidated Balance Sheets.
Deposits In-Transit
Deposits in-transit generally represent funds deposited to the Company’s bank accounts at the end of the year related to sales, a majority of which were paid for with debit cards, credit cards and checks, to which the Company does not have immediate access but settle within a few days of the sales transaction.
Inventories
Inventories are stated at the lower of cost (principally on a last-in, first-out “LIFO” basis) or market. In total, approximately 95% of inventories in 2015 and 2014 were valued using the LIFO method. Cost for the balance of the inventories, including substantially all fuel inventories, was determined using the first-in, first-out (“FIFO”) method. Replacement cost was higher than the carrying amount by $1,272 at January 30, 2016 and $1,245 at January 31, 2015. The Company follows the Link-Chain, Dollar-Value LIFO method for purposes of calculating its LIFO charge or credit.
A-36
The item-cost method of accounting to determine inventory cost before the LIFO adjustment is followed for substantially all store inventories at the Company’s supermarket divisions. This method involves counting each item in inventory, assigning costs to each of these items based on the actual purchase costs (net of vendor allowances and cash discounts) of each item and recording the cost of items sold. The item-cost method of accounting allows for more accurate reporting of periodic inventory balances and enables management to more precisely manage inventory. In addition, substantially all of the Company’s inventory consists of finished goods and is recorded at actual purchase costs (net of vendor allowances and cash discounts).
The Company evaluates inventory shortages throughout the year based on actual physical counts in its facilities. Allowances for inventory shortages are recorded based on the results of these counts to provide for estimated shortages as of the financial statement date.
Property, Plant and Equipment
Property, plant and equipment are recorded at cost or, in the case of assets acquired in a business combination, at fair value. Depreciation and amortization expense, which includes the depreciation of assets recorded under capital leases, is computed principally using the straight-line method over the estimated useful lives of individual assets. Buildings and land improvements are depreciated based on lives varying from 10 to 40 years. All new purchases of store equipment are assigned lives varying from three to nine years. Leasehold improvements are amortized over the shorter of the lease term to which they relate, which generally varies from four to 25 years, or the useful life of the asset. Food production plant and distribution center equipment is depreciated over lives varying from three to 15 years. Information technology assets are generally depreciated over five years. Depreciation and amortization expense was $2,089 in 2015, $1,948 in 2014 and $1,703 in 2013.
Interest costs on significant projects constructed for the Company’s own use are capitalized as part of the costs of the newly constructed facilities. Upon retirement or disposal of assets, the cost and related accumulated depreciation and amortization are removed from the balance sheet and any gain or loss is reflected in net earnings. Refer to Note 4 for further information regarding the Company’s property, plant and equipment.
Deferred Rent
The Company recognizes rent holidays, including the time period during which the Company has access to the property for construction of buildings or improvements and escalating rent provisions on a straight-line basis over the term of the lease. The deferred amount is included in “Other current liabilities” and “Other long-term liabilities” on the Company’s Consolidated Balance Sheets.
Goodwill
The Company reviews goodwill for impairment during the fourth quarter of each year, and also upon the occurrence of a triggering event. The Company performs reviews of each of its operating divisions and variable interest entities (collectively, “reporting units”) that have goodwill balances. Generally, fair value is determined using a multiple of earnings, or discounted projected future cash flows, and is compared to the carrying value of a reporting unit for purposes of identifying potential impairment. Projected future cash flows are based on management’s knowledge of the current operating environment and expectations for the future. If potential for impairment is identified, the fair value of a reporting unit is measured against the fair value of its underlying assets and liabilities, excluding goodwill, to estimate an implied fair value of the reporting unit’s goodwill. Goodwill impairment is recognized for any excess of the carrying value of the reporting unit’s goodwill over the implied fair value. Results of the goodwill impairment reviews performed during 2015, 2014 and 2013 are summarized in Note 3.
A-37
Impairment of Long-Lived Assets
The Company monitors the carrying value of long-lived assets for potential impairment each quarter based on whether certain triggering events have occurred. These events include current period losses combined with a history of losses or a projection of continuing losses or a significant decrease in the market value of an asset. When a triggering event occurs, an impairment calculation is performed, comparing projected undiscounted future cash flows, utilizing current cash flow information and expected growth rates related to specific stores, to the carrying value for those stores. If the Company identifies impairment for long-lived assets to be held and used, the Company compares the assets’ current carrying value to the assets’ fair value. Fair value is based on current market values or discounted future cash flows. The Company records impairment when the carrying value exceeds fair market value. With respect to owned property and equipment held for disposal, the value of the property and equipment is adjusted to reflect recoverable values based on previous efforts to dispose of similar assets and current economic conditions. Impairment is recognized for the excess of the carrying value over the estimated fair market value, reduced by estimated direct costs of disposal. The Company recorded asset impairments in the normal course of business totaling $46, $37 and $39 in 2015, 2014 and 2013, respectively. Costs to reduce the carrying value of long-lived assets for each of the years presented have been included in the Consolidated Statements of Operations as “Operating, general and administrative” expense.
Store Closing Costs
The Company provides for closed store liabilities relating to the present value of the estimated remaining non-cancellable lease payments after the closing date, net of estimated subtenant income. The Company estimates the net lease liabilities using a discount rate to calculate the present value of the remaining net rent payments on closed stores. The closed store lease liabilities usually are paid over the lease terms associated with the closed stores, which generally have remaining terms ranging from one to 20 years. Adjustments to closed store liabilities primarily relate to changes in subtenant income and actual exit costs differing from original estimates. Adjustments are made for changes in estimates in the period in which the change becomes known. Store closing liabilities are reviewed quarterly to ensure that any accrued amount that is not a sufficient estimate of future costs is adjusted to income in the proper period.
Owned stores held for disposal are reduced to their estimated net realizable value. Costs to reduce the carrying values of property, equipment and leasehold improvements are accounted for in accordance with the Company’s policy on impairment of long-lived assets. Inventory write-downs, if any, in connection with store closings, are classified in the Consolidated Statements of Operations as “Merchandise costs.” Costs to transfer inventory and equipment from closed stores are expensed as incurred.
The current portion of the future lease obligations of stores is included in “Other current liabilities,” and the long-term portion is included in “Other long-term liabilities” in the Consolidated Balance Sheets.
Interest Rate Risk Management
The Company uses derivative instruments primarily to manage its exposure to changes in interest rates. The Company’s current program relative to interest rate protection and the methods by which the Company accounts for its derivative instruments are described in Note 7.
Commodity Price Protection
The Company enters into purchase commitments for various resources, including raw materials utilized in its food production plants and energy to be used in its stores, food production plants and administrative offices. The Company enters into commitments expecting to take delivery of and to utilize those resources in the conduct of the normal course of business. The Company’s current program relative to commodity price protection and the methods by which the Company accounts for its purchase commitments are described in Note 7.
A-38
Benefit Plans and Multi-Employer Pension Plans
The Company recognizes the funded status of its retirement plans on the Consolidated Balance Sheets. Actuarial gains or losses, prior service costs or credits and transition obligations that have not yet been recognized as part of net periodic benefit cost are required to be recorded as a component of Accumulated Other Comprehensive Income (“AOCI”). All plans are measured as of the Company’s fiscal year end.
The determination of the obligation and expense for Company-sponsored pension plans and other post-retirement benefits is dependent on the selection of assumptions used by actuaries and the Company in calculating those amounts. Those assumptions are described in Note 15 and include, among others, the discount rate, the expected long-term rate of return on plan assets, mortality and the rates of increase in compensation and health care costs. Actual results that differ from the assumptions are accumulated and amortized over future periods and, therefore, generally affect the recognized expense and recorded obligation in future periods. While the Company believes that the assumptions are appropriate, significant differences in actual experience or significant changes in assumptions may materially affect the pension and other post-retirement obligations and future expense.
The Company also participates in various multi-employer plans for substantially all union employees. Pension expense for these plans is recognized as contributions are funded. Refer to Note 16 for additional information regarding the Company’s participation in these various multi-employer plans.
The Company administers and makes contributions to the employee 401(k) retirement savings accounts. Contributions to the employee 401(k) retirement savings accounts are expensed when contributed. Refer to Note 15 for additional information regarding the Company’s benefit plans.
Share Based Compensation
The Company accounts for stock options under fair value recognition provisions. Under this method, the Company recognizes compensation expense for all share-based payments granted. The Company recognizes share-based compensation expense, net of an estimated forfeiture rate, over the requisite service period of the award. In addition, the Company records expense for restricted stock awards in an amount equal to the fair market value of the underlying stock on the grant date of the award, over the period the awards lapse. Refer to Note 12 for additional information regarding the Company’s stock based compensation.
Deferred Income Taxes
Deferred income taxes are recorded to reflect the tax consequences of differences between the tax basis of assets and liabilities and their financial reporting basis. Refer to Note 5 for the types of differences that give rise to significant portions of deferred income tax assets and liabilities. Deferred income taxes are classified as a net current or noncurrent asset or liability based on the classification of the related asset or liability for financial reporting purposes. A deferred tax asset or liability that is not related to an asset or liability for financial reporting is classified according to the expected reversal date.
Uncertain Tax Positions
The Company reviews the tax positions taken or expected to be taken on tax returns to determine whether and to what extent a benefit can be recognized in its consolidated financial statements. Refer to Note 5 for the amount of unrecognized tax benefits and other related disclosures related to uncertain tax positions.
A-39
Various taxing authorities periodically audit the Company’s income tax returns. These audits include questions regarding the Company’s tax filing positions, including the timing and amount of deductions and the allocation of income to various tax jurisdictions. In evaluating the exposures connected with these various tax filing positions, including state and local taxes, the Company records allowances for probable exposures. A number of years may elapse before a particular matter, for which an allowance has been established, is audited and fully resolved. As of January 30, 2016, the Internal Revenue Service had concluded its examination of the Company’s 2010 and 2011 federal tax returns. Tax years 2012 and 2013 remain under examination.
The assessment of the Company’s tax position relies on the judgment of management to estimate the exposures associated with the Company’s various filing positions.
Self-Insurance Costs
The Company is primarily self-insured for costs related to workers’ compensation and general liability claims. Liabilities are actuarially determined and are recognized based on claims filed and an estimate of claims incurred but not reported. The liabilities for workers’ compensation claims are accounted for on a present value basis. The Company has purchased stop-loss coverage to limit its exposure to any significant exposure on a per claim basis. The Company is insured for covered costs in excess of these per claim limits.
The following table summarizes the changes in the Company’s self-insurance liability through January 30, 2016.
| 2015 | 2014 | 2013 | ||||||||||
| Beginning balance | $ | 599 | $ | 569 | $ | 537 | ||||||
| Expense | 234 | 246 | 220 | |||||||||
| Claim payments | (225 | ) | (216 | ) | (215 | ) | ||||||
| Assumed from Roundy’s or Harris Teeter | 31 | — | 27 | |||||||||
| Ending balance | 639 | 599 | 569 | |||||||||
| Less: Current portion | (223 | ) | (213 | ) | (224 | ) | ||||||
| Long-term portion | $ | 416 | $ | 386 | $ | 345 | ||||||
The current portion of the self-insured liability is included in “Other current liabilities,” and the long-term portion is included in “Other long-term liabilities” in the Consolidated Balance Sheets.
The Company maintains surety bonds related to self-insured workers’ compensation claims. These bonds are required by most states in which the Company is self-insured for workers’ compensation and are placed with third-party insurance providers to insure payment of the Company’s obligations in the event the Company is unable to meet its claim payment obligations up to its self-insured retention levels. These bonds do not represent liabilities of the Company, as the Company has recorded reserves for the claim costs.
The Company is similarly self-insured for property-related losses. The Company maintains stop loss coverage to limit its property loss exposures including coverage for earthquake, wind, flood and other catastrophic events.
A-40
Revenue Recognition
Revenues from the sale of products are recognized at the point of sale. Discounts provided to customers by the Company at the time of sale, including those provided in connection with loyalty cards, are recognized as a reduction in sales as the products are sold. Discounts provided by vendors, usually in the form of paper coupons, are not recognized as a reduction in sales provided the coupons are redeemable at any retailer that accepts coupons. The Company records a receivable from the vendor for the difference in sales price and cash received. Pharmacy sales are recorded when product is provided to the customer. Sales taxes are recorded as other accrued liabilities and not as a component of sales. The Company does not recognize a sale when it sells its own gift cards and gift certificates. Rather, it records a deferred liability equal to the amount received. A sale is then recognized when the gift card or gift certificate is redeemed to purchase the Company’s products. Gift card and certificate breakage is recognized when redemption is deemed remote and there is no legal obligation to remit the value of the unredeemed gift card. The amount of breakage has not been material for 2015, 2014 and 2013.
Merchandise Costs
The “Merchandise costs” line item of the Consolidated Statements of Operations includes product costs, net of discounts and allowances; advertising costs (see separate discussion below); inbound freight charges; warehousing costs, including receiving and inspection costs; transportation costs; and food production and operational costs. Warehousing, transportation and manufacturing management salaries are also included in the “Merchandise costs” line item; however, purchasing management salaries and administration costs are included in the “Operating, general and administrative” line item along with most of the Company’s other managerial and administrative costs. Rent expense and depreciation and amortization expense are shown separately in the Consolidated Statements of Operations.
Warehousing and transportation costs include distribution center direct wages, transportation direct wages, repairs and maintenance, utilities, inbound freight and, where applicable, third party warehouse management fees. These costs are recognized in the periods the related expenses are incurred.
The Company believes the classification of costs included in merchandise costs could vary widely throughout the industry. The Company’s approach is to include in the “Merchandise costs” line item the direct, net costs of acquiring products and making them available to customers in its stores. The Company believes this approach most accurately presents the actual costs of products sold.
The Company recognizes all vendor allowances as a reduction in merchandise costs when the related product is sold. When possible, vendor allowances are applied to the related product cost by item and, therefore, reduce the carrying value of inventory by item. When the items are sold, the vendor allowance is recognized. When it is not possible, due to systems constraints, to allocate vendor allowances to the product by item, vendor allowances are recognized as a reduction in merchandise costs based on inventory turns and, therefore, recognized as the product is sold.
Advertising Costs
The Company’s advertising costs are recognized in the periods the related expenses are incurred and are included in the “Merchandise costs” line item of the Consolidated Statements of Operations. The Company’s pre-tax advertising costs totaled $679 in 2015, $648 in 2014 and $587 in 2013. The Company does not record vendor allowances for co-operative advertising as a reduction of advertising expense.
Consolidated Statements of Cash Flows
For purposes of the Consolidated Statements of Cash Flows, the Company considers all highly liquid debt instruments purchased with an original maturity of three months or less to be temporary cash investments.
A-41
Segments
The Company operates retail food and drug stores, multi-department stores, jewelry stores, and convenience stores throughout the United States. The Company’s retail operations, which represent over 99% of the Company’s consolidated sales and EBITDA, are its only reportable segment. The Company’s retail operating divisions have been aggregated into one reportable segment due to the operating divisions having similar economic characteristics with similar long-term financial performance. In addition, the Company’s operating divisions offer to its customers similar products, have similar distribution methods, operate in similar regulatory environments, purchase the majority of the Company’s merchandise for retail sale from similar (and in many cases identical) vendors on a coordinated basis from a centralized location, serve similar types of customers, and are allocated capital from a centralized location. The Company’s operating divisions reflect the manner in which the business is managed and how the Company’s Chief Executive Officer, who acts as the Company’s chief operating decision maker, assess performance internally. All of the Company’s operations are domestic.
The following table presents sales revenue by type of product for 2015, 2014 and 2013.
| 2015 | 2014 | 2013 | |||||||||||||||||||
| Amount | % of total | Amount | % of total | Amount | % of total | ||||||||||||||||
| Non Perishable(1) | $ | 57,187 | 52.1% | $ | 54,392 | 50.1% | $ | 49,229 | 50.0% | ||||||||||||
| Perishable(2) | 25,726 | 23.4% | 24,178 | 22.3% | 20,625 | 21.0% | |||||||||||||||
| Fuel | 14,802 | 13.5% | 18,850 | 17.4% | 18,962 | 19.3% | |||||||||||||||
| Pharmacy | 9,778 | 8.9% | 9,032 | 8.3% | 8,073 | 8.2% | |||||||||||||||
| Other(3) | 2,337 | 2.1% | 2,013 | 1.9% | 1,486 | 1.5% | |||||||||||||||
| Total Sales and other revenue | $ | 109,830 | 100.0% | $ | 108,465 | 100.0% | $ | 98,375 | 100.0% | ||||||||||||
2. Mergers
On December 18, 2015, the Company closed its merger with Roundy’s by purchasing 100% of Roundy’s outstanding common stock for $3.60 per share and assuming Roundy’s outstanding debt, for a purchase price of $866. The merger brings a complementary store base in communities throughout Wisconsin and a stronger presence in the greater Chicagoland area. The merger was accounted for under the purchase method of accounting and was financed through a combination of commercial paper and long-term debt (see Note 6). In a business combination, the purchase price is allocated to assets acquired and liabilities assumed based on their fair values, with any excess of purchase price over fair value recognized as goodwill. In addition to recognizing the assets and liabilities on the acquired company’s balance sheet, the Company reviews supply contracts, leases, financial instruments, employment agreements and other significant agreements to identify potential assets or liabilities that require recognition in connection with the application of acquisition accounting under Accounting Standards Codification (“ASC”) 805. Intangible assets are recognized apart from goodwill when the asset arises from contractual or other legal rights, or are separable from the acquired entity such that they may be sold, transferred, licensed, rented or exchanged either on a standalone basis or in combination with a related contract, asset or liability.
A-42
Pending finalization of the Company’s valuation and other items, the following table summarizes the preliminary fair values of the assets acquired and liabilities assumed as part of the merger with Roundy’s:
| December 18, 2015 | ||||||
| ASSETS | ||||||
| Cash and temporary cash investments | $ | 20 | ||||
| Store deposits in-transit | 30 | |||||
| Receivables | 43 | |||||
| FIFO inventory | 323 | |||||
| Prepaid and other current assets | 19 | |||||
| Total current assets | 435 | |||||
| Property, plant and equipment | 342 | |||||
| Intangibles | 324 | |||||
| Other assets | 4 | |||||
| Total Assets, excluding Goodwill | 1,105 | |||||
| LIABILITIES | ||||||
| Current portion of obligations under capital leases and financing obligations | (9 | ) | ||||
| Trade accounts payable | (236 | ) | ||||
| Accrued salaries and wages | (40 | ) | ||||
| Other current liabilities | (89 | ) | ||||
| Total current liabilities | (374 | ) | ||||
| Fair-value of long-term debt | (678 | ) | ||||
| Fair-value of long-term obligations under capital leases and financing obligations | (20 | ) | ||||
| Deferred income taxes | (112 | ) | ||||
| Pension and postretirement benefit obligations | (36 | ) | ||||
| Other long-term liabilities | (111 | ) | ||||
| Total Liabilities | (1,331 | ) | ||||
| Total Identifiable Net Liabilities | (226 | ) | ||||
| Goodwill | 414 | |||||
| Total Purchase Price | $ | 188 | ||||
Of the $324 allocated to intangible assets, $211 relates to the Mariano’s, Pick ’n Save, Metro Market and Copps trade names, to which we assigned an indefinite life and, therefore, will not be amortized. The Company also recorded $69, $38, and $6 related to favorable leasehold interests, pharmacy prescription files and customer lists, respectively. The Company will amortize the favorable leasehold interests over a weighted average of twelve years. The Company will amortize the pharmacy prescription files and customer lists over seven and two years, respectively. The goodwill recorded as part of the merger was attributable to the assembled workforce of Roundy’s and operational synergies expected from the merger, as well as any intangible assets that do not qualify for separate recognition. The transaction was treated as a stock purchase for income tax purposes. The assets acquired and liabilities assumed as part of the merger did not result in a step up of the tax basis and goodwill is not expected to be deductible for tax purposes. The above amounts represent the preliminary allocation of the purchase price, and are subject to revision when the resulting valuations of property and intangible assets are finalized, which will occur prior to December 18, 2016. Due to the timing of the merger closing late in the year, the revenue and earnings of Roundy’s in 2015 were not material.
A-43
On August 18, 2014, the Company closed its merger with Vitacost.com, Inc. (“Vitacost.com”) by purchasing 100% of the Vitacost.com outstanding common stock for $8.00 per share or $287. This merger affords the Company access to Vitacost.com’s extensive e-commerce platform, which can be combined with the Company’s customer insights and loyal customer base, to create new levels of personalization and convenience for customers. The merger was accounted for under the purchase method of accounting and was financed through the issuance of commercial paper (see Note 6).
The Company’s purchase price allocation was finalized in the second quarter of 2015. The changes in the fair values assumed from the preliminary amounts were not material. The table below summarizes the final fair values of the assets acquired and liabilities assumed:
| August 18, 2014 | ||||||
| ASSETS | ||||||
| Total current assets | $ | 80 | ||||
| Property, plant and equipment | 28 | |||||
| Intangibles | 81 | |||||
| Total Assets, excluding Goodwill | 189 | |||||
| LIABILITIES | ||||||
| Total current liabilities | (56 | ) | ||||
| Deferred income taxes | (6 | ) | ||||
| Total Liabilities | (62 | ) | ||||
| Total Identifiable Net Assets | 127 | |||||
| Goodwill | 160 | |||||
| Total Purchase Price | $ | 287 | ||||
Of the $81 allocated to intangible assets, the Company recorded $49, $26 and $6 related to customer relationships, technology and the trade name, respectively. The Company will amortize the technology and the trade name, using the straight line method, over 10 and three years, respectively, while the customer relationships will be amortized over five years using the declining balance method. The goodwill recorded as part of the merger was attributable to the assembled workforce of Vitacost.com and operational synergies expected from the merger, as well as any intangible assets that did not qualify for separate recognition. The transaction was treated as a stock purchase for income tax purposes. The assets acquired and liabilities assumed as part of the merger did not result in a step up of the tax basis and goodwill is not expected to be deductible for tax purposes.
Pro forma results of operations, assuming the Harris Teeter Supermarkets, Inc. (“Harris Teeter”) merger had taken place at the beginning of 2012, the Vitacost.com merger had taken place at the beginning of 2013 and the Roundy’s transaction had taken place at the beginning of 2014, are included in the following table. The pro forma information includes historical results of operations of Harris Teeter, Vitacost.com and Roundy’s, as well as adjustments for interest expense that would have been incurred due to financing the mergers, depreciation and amortization of the assets acquired and excludes the pre-merger transaction related expenses incurred by Harris Teeter, Vitacost.com, Roundy’s and the Company. The pro forma information does not include efficiencies, cost reductions, synergies or investments in lower prices for our customers expected to result from the mergers. The unaudited pro
A-44
forma financial information is not necessarily indicative of the results that actually would have occurred had the Harris Teeter merger been completed at the beginning of 2012, the Vitacost.com merger completed at the beginning of 2013 or the Roundy’s merger completed at the beginning of 2014.
| Fiscal year ended January 30, 2016 | Fiscal year ended January 31, 2015 | Fiscal year ended February 1, 2014 | |||||||||||||
| Sales | $ | 113,308 | $ | 112,458 | $ | 103,584 | |||||||||
| Net earnings including noncontrolling interests | 2,061 | 1,751 | 1,624 | ||||||||||||
| Net earnings attributable to noncontrolling interests | 10 | 19 | 12 | ||||||||||||
| Net earnings attributable to The Kroger Co. | $ | 2,051 | $ | 1,732 | $ | 1,612 | |||||||||
3. Goodwill and Intangible Assets
The following table summarizes the changes in the Company’s net goodwill balance through January 30, 2016.
| 2015 | 2014 | ||||||||
| Balance beginning of year | |||||||||
| Goodwill | $ | 4,836 | $ | 4,667 | |||||
| Accumulated impairment losses | (2,532 | ) | (2,532 | ) | |||||
| 2,304 | 2,135 | ||||||||
| Activity during the year | |||||||||
| Mergers | 420 | 169 | |||||||
| Balance end of year | |||||||||
| Goodwill | 5,256 | 4,836 | |||||||
| Accumulated impairment losses | (2,532 | ) | (2,532 | ) | |||||
| $ | 2,724 | $ | 2,304 | ||||||
In 2015, the Company acquired all the outstanding shares of Roundy’s, a supermarket retailer in the Wisconsin and Chicagoland markets, resulting in additional goodwill totaling $414. Roundy’s is accounted for as a single reporting unit.
In 2014, the Company acquired all the outstanding shares of Vitacost.com, an online retailer, resulting in additional goodwill of $160.
See Note 2 for additional information regarding the Roundy’s and Vitacost.com mergers.
Testing for impairment must be performed annually, or on an interim basis upon the occurrence of a triggering event or a change in circumstances that would more likely than not reduce the fair value of a reporting unit below its carrying amount. The annual evaluations of goodwill and indefinite-lived intangible assets were performed during the fourth quarter of 2015, 2014 and 2013 did not result in impairment.
Based on current and future expected cash flows, the Company believes goodwill impairments are not reasonably likely. A 10% reduction in fair value of the Company’s reporting units would not indicate a potential for impairment of the Company’s remaining goodwill balance.
In 2015, the Company acquired definite and indefinite lived intangible assets totaling approximately $324 as a result of the merger with Roundy’s.
In 2014, the Company acquired definite and indefinite lived intangible assets totaling approximately $81 as a result of the merger with Vitacost.com.
A-45
The following table summarizes the Company’s intangible assets balance through January 30, 2016.
| 2015 | 2014 | |||||||||||||||||||||
| Gross carrying amount | Accumulated | Gross carrying amount | Accumulated amortization(1) | |||||||||||||||||||
| Definite-lived favorable leasehold interests | $ | 169 | $ | (31 | ) | $ | 101 | $ | (26 | ) | ||||||||||||
| Definite-lived pharmacy prescription files | 127 | (40 | ) | 98 | (41 | ) | ||||||||||||||||
| Definite-lived customer relationships | 93 | (39 | ) | 87 | (17 | ) | ||||||||||||||||
| Definite-lived other | 78 | (23 | ) | 74 | (13 | ) | ||||||||||||||||
| Indefinite-lived trade name | 641 | — | 430 | — | ||||||||||||||||||
| Indefinite-lived liquor licenses | 78 | — | 64 | — | ||||||||||||||||||
| Total | $ | 1,186 | $ | (133 | ) | $ | 854 | $ | (97 | ) | ||||||||||||
Amortization expense associated with intangible assets totaled approximately $51, $41 and $18, during fiscal years 2015, 2014 and 2013, respectively. Future amortization expense associated with the net carrying amount of definite-lived intangible assets for the years subsequent to 2015 is estimated to be approximately:
| 2016 | $ | 57 | |
| 2017 | 48 | ||
| 2018 | 42 | ||
| 2019 | 40 | ||
| 2020 | 35 | ||
| Thereafter | 112 | ||
| Total future estimated amortization associated | |||
| with definite-lived intangible assets | $ | 334 |
4. Property, Plant and Equipment, Net
Property, plant and equipment, net consists of:
| 2015 | 2014 | ||||||||
| Land | $ | 2,997 | $ | 2,819 | |||||
| Buildings and land improvements | 10,524 | 9,639 | |||||||
| Equipment | 12,520 | 11,587 | |||||||
| Leasehold improvements | 8,710 | 8,068 | |||||||
| Construction-in-progress | 2,115 | 1,690 | |||||||
| Leased property under capital leases and financing obligations | 801 | 737 | |||||||
| Total property, plant and equipment | 37,667 | 34,540 | |||||||
| Accumulated depreciation and amortization | (18,048 | ) | (16,628 | ) | |||||
| Property, plant and equipment, net | $ | 19,619 | $ | 17,912 | |||||
Accumulated depreciation and amortization for leased property under capital leases was $293 at January 30, 2016 and $332 at January 31, 2015.
A-46
Approximately $264 and $260, net book value, of property, plant and equipment collateralized certain mortgages at January 30, 2016 and January 31, 2015, respectively.
5. TAXES BASEDON INCOME
The provision for taxes based on income consists of:
| 2015 | 2014 | 2013 | |||||||||
| Federal | |||||||||||
| Current | $ | 723 | $ | 847 | $ | 638 | |||||
| Deferred | 266 | (15 | ) | 81 | |||||||
| Subtotal federal | 989 | 832 | 719 | ||||||||
| State and local | |||||||||||
| Current | 37 | 59 | 42 | ||||||||
| Deferred | 19 | 11 | (10 | ) | |||||||
| Subtotal state and local | 56 | 70 | 32 | ||||||||
| Total | $ | 1,045 | $ | 902 | $ | 751 | |||||
A reconciliation of the statutory federal rate and the effective rate follows:
| 2015 | 2014 | 2013 | |||||||
| Statutory rate | 35.0 | % | 35.0 | % | 35.0 | % | |||
| State income taxes, net of federal tax benefit | 1.2 | % | 1.7 | % | 0.9 | % | |||
| Credits | (1.2 | )% | (1.2 | )% | (1.3 | )% | |||
| Favorable resolution of issues | (0.2 | )% | (0.4 | )% | — | % | |||
| Domestic manufacturing deduction | (0.7 | )% | (0.7 | )% | (1.1 | )% | |||
| Other changes, net | (0.3 | )% | (0.3 | )% | (0.6 | )% | |||
| 33.8 | % | 34.1 | % | 32.9 | % | ||||
The 2015 effective tax rate differed from the federal statutory rate primarily as a result of the utilization of tax credits, the Domestic Manufacturing Deduction and other changes, partially offset by the effect of state income taxes. The 2015 rate for state income taxes is lower than 2014 due to the filing of amended returns to claim additional benefits in years still under review, the favorable resolution of state issues and an increase in state credits. The 2013 rate for state income taxes is lower than 2015 and 2014 due to an increase in state credits, including the benefit from filing amended returns to claim additional credits. The 2013 benefit from the Domestic Manufacturing Deduction is greater than 2015 and 2014 due to the amendment of prior years’ tax returns to claim the additional benefit available in years still under review by the Internal Revenue Service.
A-47
The tax effects of significant temporary differences that comprise tax balances were as follows:
| 2015 | 2014 | |||||||
| Current deferred tax assets: | ||||||||
| Net operating loss and credit carryforwards | $ | 10 | $ | 5 | ||||
| Compensation related costs | 83 | 88 | ||||||
| Other | 61 | 14 | ||||||
| Subtotal | 154 | 107 | ||||||
| Valuation allowance | (9 | ) | (7 | ) | ||||
| Total current deferred tax assets | 145 | 100 | ||||||
| Current deferred tax liabilities: | ||||||||
| Insurance related costs | (56 | ) | (99 | ) | ||||
| Inventory related costs | (310 | ) | (288 | ) | ||||
| Total current deferred tax liabilities | (366 | ) | (387 | ) | ||||
| Current deferred taxes | $ | (221 | ) | $ | (287 | ) | ||
| Long-term deferred tax assets: | ||||||||
| Compensation related costs | $ | 709 | $ | 721 | ||||
| Lease accounting | 106 | 129 | ||||||
| Closed store reserves | 57 | 50 | ||||||
| Insurance related costs | 29 | 77 | ||||||
| Net operating loss and credit carryforwards | 128 | 115 | ||||||
| Other | 17 | 2 | ||||||
| Subtotal | 1,046 | 1,094 | ||||||
| Valuation allowance | (43 | ) | (42 | ) | ||||
| Total long-term deferred tax assets | 1,003 | 1,052 | ||||||
| Long-term deferred tax liabilities: | ||||||||
| Depreciation and amortization | (2,755 | ) | (2,261 | ) | ||||
| Total long-term deferred tax liabilities | (2,755 | ) | (2,261 | ) | ||||
| Long-term deferred taxes | $ | (1,752 | ) | $ | (1,209 | ) | ||
On November 19, 2015, the Internal Revenue Service issued implementation guidance for retailers with respect to recently issued tangible property regulations. The adoption of this guidance resulted in the immediate deduction of qualifying costs related to current and prior year store remodels, resulting in an increase in long-term deferred tax liability and current income tax receivable. The adoption of this guidance, along with the impact of the Roundy’s merger, resulted in the increase in the deferred tax liability related to depreciation and amortization from January 31, 2015 to January 30, 2016.
At January 30, 2016, the Company had net operating loss carryforwards for state income tax purposes of $1,460. These net operating loss carryforwards expire from 2016 through 2036. The utilization of certain of the Company’s state net operating loss carryforwards may be limited in a given year. Further, based on the analysis described below, the Company has recorded a valuation allowance against some of the deferred tax assets resulting from its state net operating losses.
A-48
At January 30, 2016, the Company had state credit carryforwards of $65, most of which expire from 2016 through 2027. The utilization of certain of the Company’s credits may be limited in a given year. Further, based on the analysis described below, the Company has recorded a valuation allowance against some of the deferred tax assets resulting from its state credits.
At January 30, 2016, the Company had federal net operating loss carryforwards of $62. These net operating loss carryforwards expire from 2030 through 2034. The utilization of certain of the Company’s federal net operating loss carryforwards may be limited in a given year. Further, based on the analysis described below, the Company has not recorded a valuation allowance against the deferred tax assets resulting from its federal net operating losses.
The Company regularly reviews all deferred tax assets on a tax filer and jurisdictional basis to estimate whether these assets are more likely than not to be realized based on all available evidence. This evidence includes historical taxable income, projected future taxable income, the expected timing of the reversal of existing temporary differences and the implementation of tax planning strategies. Projected future taxable income is based on expected results and assumptions as to the jurisdiction in which the income will be earned. The expected timing of the reversals of existing temporary differences is based on current tax law and the Company’s tax methods of accounting. Unless deferred tax assets are more likely than not to be realized, a valuation allowance is established to reduce the carrying value of the deferred tax asset until such time that realization becomes more likely than not. Increases and decreases in these valuation allowances are included in “Income tax expense” in the Consolidated Statements of Operations.
A reconciliation of the beginning and ending amount of unrecognized tax benefits, including positions impacting only the timing of tax benefits, is as follows:
| 2015 | 2014 | 2013 | ||||||||||
| Beginning balance | $ | 246 | $ | 325 | $ | 299 | ||||||
| Additions based on tax positions related to the current year | 11 | 17 | 23 | |||||||||
| Reductions based on tax positions related to the current year | (11 | ) | (6 | ) | (10 | ) | ||||||
| Additions for tax positions of prior years | 4 | 9 | 17 | |||||||||
| Reductions for tax positions of prior years | (27 | ) | (36 | ) | (4 | ) | ||||||
| Settlements | (17 | ) | (63 | ) | — | |||||||
| Lapse of statute | (2 | ) | — | — | ||||||||
| Ending balance | $ | 204 | $ | 246 | $ | 325 | ||||||
The Company does not anticipate that changes in the amount of unrecognized tax benefits over the next twelve months will have a significant impact on its results of operations or financial position.
As of January 30, 2016, January 31, 2015 and February 1, 2014, the amount of unrecognized tax benefits that, if recognized, would impact the effective tax rate was $83, $90 and $98, respectively.
To the extent interest and penalties would be assessed by taxing authorities on any underpayment of income tax, such amounts have been accrued and classified as a component of income tax expense. During the years ended January 30, 2016, January 31, 2015 and February 1, 2014, the Company recognized approximately $(5), $3 and $10, respectively, in interest and penalties (recoveries). The Company had accrued approximately $25, $30 and $41 for the payment of interest and penalties as of January 30, 2016, January 31, 2015 and February 1, 2014, respectively.
As of January 31, 2015, the Internal Revenue Service had concluded its examination of our 2010 and 2011 federal tax returns and is currently auditing tax years 2012 and 2013. The 2012 and 2013 audits are expected to be completed in 2016.
A-49
6. DEBT OBLIGATIONS
Long-term debt consists of:
| 2015 | 2014 | |||||||
| 0.76% to 8.00% Senior notes due through 2043 | $ | 9,826 | $ | 9,224 | ||||
| 5.00% to 12.75% Mortgages due in varying amounts through 2027 | 58 | 73 | ||||||
| 0.27% to 0.66% Commercial paper due through February 2016 | 990 | 1,275 | ||||||
| Other | 522 | 454 | ||||||
| Total debt | 11,396 | 11,026 | ||||||
| Less current portion | (2,318 | ) | (1,844 | ) | ||||
| Total long-term debt | $ | 9,078 | $ | 9,182 | ||||
In 2015, the Company issued $500 of senior notes due in fiscal year 2026 bearing an interest rate of 3.50%, $300 of senior notes due in fiscal year 2021 bearing an interest rate of 2.60% and $300 of senior notes due in fiscal year 2019 bearing an interest rate of 2.00%, and repaid $500 of senior notes bearing an interest rate of 3.90% upon maturity. Due to the merger with Roundy’s, the Company assumed $678 of term loans, which were entirely paid off following the merger.
In 2014, the Company issued $500 of senior notes due in fiscal year 2021 bearing an interest rate of 2.95% and repaid $300 of senior notes bearing an interest rate of 4.95% upon maturity.
On June 30, 2014, the Company amended, extended and restated its $2,000 unsecured revolving credit facility. The Company entered into the amended credit facility to amend, extend and restate the Company’s existing credit facility that would have terminated on January 25, 2017. The amended credit facility provides for a $2,750 unsecured revolving credit facility (the “Credit Agreement”), with a termination date of June 30, 2019, unless extended as permitted under the Credit Agreement. The Company has the ability to increase the size of the Credit Agreement by up to an additional $750, subject to certain conditions.
Borrowings under the Credit Agreement bear interest at the Company’s option, at either (i) LIBOR plus a market rate spread, based on the Company’s Leverage Ratio or (ii) the base rate, defined as the highest of (a) the Federal Funds Rate plus 0.5%, (b) the Bank of America prime rate, and (c) one-month LIBOR plus 1.0%, plus a market rate spread based on the Company’s Leverage Ratio. The Company will also pay a Commitment Fee based on the Leverage Ratio and Letter of Credit fees equal to a market rate spread based on the Company’s Leverage Ratio. The Credit Agreement contains covenants, which, among other things, require the maintenance of a Leverage Ratio of not greater than 3.50:1.00 and a Fixed Charge Coverage Ratio of not less than 1.70:1.00. The Company may repay the Credit Agreement in whole or in part at any time without premium or penalty. The Credit Agreement is not guaranteed by the Company’s subsidiaries.
As of January 30, 2016, the Company had $990 of borrowings of commercial paper, with a weighted average interest rate of 0.66%, and no borrowings under its Credit Agreement. As of January 31, 2015, the Company had $1,275 of borrowings of commercial paper, with a weighted average interest rate of 0.37%, and no borrowings under its Credit Agreement.
As of January 30, 2016, the Company had outstanding letters of credit in the amount of $244, of which $13 reduces funds available under the Company’s Credit Agreement. The letters of credit are maintained primarily to support performance, payment, deposit or surety obligations of the Company.
A-50
Most of the Company’s outstanding public debt is subject to early redemption at varying times and premiums, at the option of the Company. In addition, subject to certain conditions, some of the Company’s publicly issued debt will be subject to redemption, in whole or in part, at the option of the holder upon the occurrence of a redemption event, upon not less than five days’ notice prior to the date of redemption, at a redemption price equal to the default amount, plus a specified premium. “Redemption Event” is defined in the indentures as the occurrence of (i) any person or group, together with any affiliate thereof, beneficially owning 50% or more of the voting power of the Company, (ii) any one person or group, or affiliate thereof, succeeding in having a majority of its nominees elected to the Company’s Board of Directors, in each case, without the consent of a majority of the continuing directors of the Company or (iii) both a change of control and a below investment grade rating.
The aggregate annual maturities and scheduled payments of long-term debt, as of year-end 2015, and for the years subsequent to 2015 are:
| 2016 | $ | 2,318 | |
| 2017 | 735 | ||
| 2018 | 1,307 | ||
| 2019 | 774 | ||
| 2020 | 724 | ||
| Thereafter | 5,538 | ||
| Total debt | $ | 11,396 |
7. DERIVATIVE FINANCIAL INSTRUMENTS
GAAP defines derivatives, requires that derivatives be carried at fair value on the balance sheet, and provides for hedge accounting when certain conditions are met. The Company’s derivative financial instruments are recognized on the balance sheet at fair value. Changes in the fair value of derivative instruments designated as “cash flow” hedges, to the extent the hedges are highly effective, are recorded in other comprehensive income, net of tax effects. Ineffective portions of cash flow hedges, if any, are recognized in current period earnings. Other comprehensive income or loss is reclassified into current period earnings when the hedged transaction affects earnings. Changes in the fair value of derivative instruments designated as “fair value” hedges, along with corresponding changes in the fair values of the hedged assets or liabilities, are recorded in current period earnings. Ineffective portions of fair value hedges, if any, are recognized in current period earnings.
The Company assesses, both at the inception of the hedge and on an ongoing basis, whether derivatives used as hedging instruments are highly effective in offsetting the changes in the fair value or cash flow of the hedged items. If it is determined that a derivative is not highly effective as a hedge or ceases to be highly effective, the Company discontinues hedge accounting prospectively.
Interest Rate Risk Management
The Company is exposed to market risk from fluctuations in interest rates. The Company manages its exposure to interest rate fluctuations through the use of a commercial paper program, interest rate swaps (fair value hedges) and forward-starting interest rate swaps (cash flow hedges). The Company’s current program relative to interest rate protection contemplates hedging the exposure to changes in the fair value of fixed-rate debt attributable to changes in interest rates. To do this, the Company uses the following guidelines: (i) use average daily outstanding borrowings to determine annual debt amounts subject to interest rate exposure, (ii) limit the average annual amount subject to interest rate reset and the amount of floating rate debt to a combined total of $2,500 or less, (iii) include no leveraged products, and (iv) hedge without regard to profit motive or sensitivity to current mark-to-market status.
A-51
The Company reviews compliance with these guidelines annually with the Financial Policy Committee of the Board of Directors. These guidelines may change as the Company’s needs dictate.
Fair Value Interest Rate Swaps
The table below summarizes the outstanding interest rate swaps designated as fair value hedges as of January 30, 2016 and January 31, 2015.
| 2015 | 2014 | ||||||||||
| Pay Floating | Pay Fixed | Pay Floating | Pay Fixed | ||||||||
| Notional amount | $ | 100 | $— | $ | 100 | $— | |||||
| Number of contracts | 2 | — | 2 | — | |||||||
| Duration in years | 2.92 | — | 3.94 | — | |||||||
| Average variable rate | 6.00 | % | — | 5.83 | % | — | |||||
| Average fixed rate | 6.80 | % | — | 6.80 | % | — | |||||
| Maturity | December 2018 | December 2018 | |||||||||
The gain or loss on these derivative instruments as well as the offsetting gain or loss on the hedged items attributable to the hedged risk is recognized in current earnings as “Interest expense.” These gains and losses for 2015 and 2014 were as follows:
| Year-To-Date | ||||||||
| January 30, 2016 | January 31, 2015 | |||||||
| Consolidated Statements of Operations Classification | Gain/ (Loss) on Swaps | Gain/ (Loss) on Borrowings | Gain/ (Loss) on Swaps | Gain/ (Loss) on Borrowings | ||||
| Interest Expense | $1 | $(1) | $2 | $(2) | ||||
The following table summarizes the location and fair value of derivative instruments designated as fair value hedges on the Company’s Consolidated Balance Sheets:
Cash Flow Forward-Starting Interest Rate Swaps
As of January 30, 2016, the Company had seven forward-starting interest rate swap agreements with maturity dates of August 2017 with an aggregate notional amount totaling $400. A forward-starting interest rate swap is an agreement that effectively hedges the variability in future benchmark interest payments attributable to changes in interest rates on the forecasted issuance of fixed-rate debt. The Company entered into these forward-starting interest rate swaps in order to lock in fixed interest rates on its forecasted issuance of debt in August 2017. Accordingly, the forward-starting interest rate swaps were designated as cash-flow hedges as defined by GAAP. As of January 30, 2016, the fair value of the interest rate swaps was recorded in other long-term liabilities for $27 and accumulated other comprehensive loss for $17 net of tax.
A-52
As of January 31, 2015, the Company had four forward-starting interest rate swap agreements with maturity dates of October 2015 with an aggregate notional amount totaling $300 and seven forward-starting interest rate swap agreements with maturity dates of August 2017 with an aggregate notional amount totaling $400. The Company entered into these forward-starting interest rate swaps in order to lock in fixed interest rates on its forecasted issuances of debt in October 2015 and August 2017. Accordingly, the forward-starting interest rate swaps were designated as cash-flow hedges as defined by GAAP. As of January 31, 2015, the fair value of the interest rate swaps was recorded in other long-term liabilities for $39 and accumulated other comprehensive loss for $25 net of tax.
During 2015, the Company terminated eight forward-starting interest rate swap agreements with maturity dates of October 2015 and January 2016 with an aggregate notional amount totaling $600. Four of these forward-starting interest rate swap agreements, with an aggregate notional amount totaling $300, were entered into and terminated in 2015. These forward-starting interest rate swap agreements were hedging the variability in future benchmark interest payments attributable to changing interest rates on the forecasted issuance of fixed-rate debt issued in 2015. As discussed in Note 6, the Company issued $1,100 of senior notes in 2015. Since these forward-starting interest rate swap agreements were classified as cash flow hedges, the unamortized loss of $17, $11 net of tax, has been deferred in AOCI and will be amortized to earnings as the interest payments are made.
The following table summarizes the effect of the Company’s derivative instruments designated as cash flow hedges for 2015 and 2014:
| Year-To-Date | ||||||||||
| Derivatives in Cash Flow Hedging Relationships | Amount of Gain/ (Loss) in AOCI on Derivative (Effective Portion) | Amount of Gain/ (Loss) Reclassified from AOCI into Income (Effective Portion) | Location of Gain/ (Loss) Reclassified into Income (Effective Portion) | |||||||
| 2015 | 2014 | 2015 | 2014 | |||||||
| Forward-Starting Interest Rate | ||||||||||
| Swaps, net of tax* | $(51) | $(49) | $(1) | $(1) | Interest expense | |||||
|
For the above fair value and cash flow interest rate swaps, the Company has entered into International Swaps and Derivatives Association master netting agreements that permit the net settlement of amounts owed under their respective derivative contracts. Under these master netting agreements, net settlement generally permits the Company or the counterparty to determine the net amount payable for contracts due on the same date and in the same currency for similar types of derivative transactions. These master netting agreements generally also provide for net settlement of all outstanding contracts with a counterparty in the case of an event of default or a termination event.
Collateral is generally not required of the counterparties or of the Company under these master netting agreements. As of January 30, 2016 and January 31, 2015, no cash collateral was received or pledged under the master netting agreements.
A-53
The effect of the net settlement provisions of these master netting agreements on the Company’s derivative balances upon an event of default or termination event is as follows as of January 30, 2016 and January 31, 2015:
| January 30, 2016 | Gross Amount Recognized | Gross Amounts Offset in the Balance Sheet | Net Amount Presented in the Balance Sheet | Gross Amounts Not Offset in the Balance Sheet | Net Amount | |||||||
| Financial Instruments | Cash Collateral | |||||||||||
| Assets | ||||||||||||
| Fair Value Interest | ||||||||||||
| Rate Swaps | $1 | $— | $1 | $— | $— | $1 | ||||||
| Liabilities | ||||||||||||
| Cash Flow Forward-Starting | ||||||||||||
| Interest Rate Swaps | 27 | — | 27 | — | — | 27 | ||||||
| January 31, 2015 | Gross Amount Recognized | Gross Amounts Offset in the Balance Sheet | Net Amount Presented inthe Balance Sheet | Gross Amounts Not Offset in the Balance Sheet | Net Amount | |||||||
Financial Instruments | Cash Collateral | |||||||||||
| Liabilities | ||||||||||||
| Cash Flow Forward-Starting | ||||||||||||
| Interest Rate Swaps | $39 | $— | $39 | $— | $— | $39 | ||||||
Commodity Price Protection
The Company enters into purchase commitments for various resources, including raw materials utilized in its food production plants and energy to be used in its stores, warehouses, food production plants and administrative offices. The Company enters into commitments expecting to take delivery of and to utilize those resources in the conduct of normal business. Those commitments for which the Company expects to utilize or take delivery in a reasonable amount of time in the normal course of business qualify as normal purchases and normal sales.
8. FAIR VALUE MEASUREMENTS
GAAP establishes a fair value hierarchy that prioritizes the inputs used to measure fair value. The three levels of the fair value hierarchy defined in the standards are as follows:
Level 1 – Quoted prices are available in active markets for identical assets or liabilities;
Level 2 – Pricing inputs are other than quoted prices in active markets included in Level 1, which are either directly or indirectly observable;
Level 3 – Unobservable pricing inputs in which little or no market activity exists, therefore requiring an entity to develop its own assumptions about the assumptions that market participants would use in pricing an asset or liability.
A-54
For items carried at (or adjusted to) fair value in the consolidated financial statements, the following tables summarize the fair value of these instruments at January 30, 2016 and January 31, 2015:
January 30, 2016 Fair Value Measurements Using
| Quoted Prices in Active Markets for Identical Assets (Level 1) | Significant Other Observable Inputs (Level 2) | Significant Unobservable Inputs (Level 3) | Total | |||||||||||
| Trading Securities | $48 | $ — | $— | $ 48 | ||||||||||
| Available-for-Sale Securities | 41 | — | — | 41 | ||||||||||
| Long-Lived Assets | — | — | 7 | 7 | ||||||||||
| Interest Rate Hedges | — | (26 | ) | — | (26 | ) | ||||||||
| Total | $89 | $(26 | ) | $ 7 | $ 70 | |||||||||
January 31, 2015 Fair Value Measurements Using
| Quoted Prices in Active Markets for Identical Assets (Level 1) | Significant Other Observable Inputs (Level 2) | Significant Unobservable Inputs (Level 3) | Total | |||||||||||
| Trading Securities | $47 | $ — | $— | $ 47 | ||||||||||
| Available-for-Sale Securities | 36 | — | — | 36 | ||||||||||
| Warrants | — | 26 | — | 26 | ||||||||||
| Long-Lived Assets | — | — | 22 | 22 | ||||||||||
| Interest Rate Hedges | — | (39 | ) | — | (39 | ) | ||||||||
| Total | $83 | $(13 | ) | $22 | $ 92 | |||||||||
In 2015 and 2014, unrealized gains on the Level 1 available-for-sale securities totaled $5 and $8, respectively.
The Company values warrants using the Black-Scholes option-pricing model. The Black-Scholes option-pricing model is classified as a Level 2 input.
The Company values interest rate hedges using observable forward yield curves. These forward yield curves are classified as Level 2 inputs.
Fair value measurements of non-financial assets and non-financial liabilities are primarily used in the impairment analysis of goodwill, other intangible assets, long-lived assets and in the valuation of store lease exit costs. The Company reviews goodwill and indefinite-lived intangible assets for impairment annually, during the fourth quarter of each fiscal year, and as circumstances indicate the possibility of impairment. See Note 3 for further discussion related to the Company’s carrying value of goodwill. Long-lived assets and store lease exit costs were measured at fair value on a nonrecurring basis using Level 3 inputs as defined in the fair value hierarchy. See Note 1 for further discussion of the Company’s policies and recorded amounts for impairments of long-lived assets and valuation of store lease exit costs. In 2015, long-lived assets with a carrying amount of $53 were written down to their fair value of $7, resulting in an impairment charge of $46. In 2014, long-lived assets with a carrying amount of $59 were written down to their fair value of $22, resulting in an impairment charge of $37.
A-55
Mergers are accounted for using the acquisition method of accounting, which requires that the purchase price paid for an acquisition be allocated to the assets and liabilities acquired based on their estimated fair values as of the effective date of the acquisition, with the excess of the purchase price over the net assets being recorded as goodwill. See Note 2 for further discussion related to accounting for mergers.
FAIR VALUEOF OTHER FINANCIAL INSTRUMENTS
Current and Long-term Debt
The fair value of the Company’s long-term debt, including current maturities, was estimated based on the quoted market prices for the same or similar issues adjusted for illiquidity based on available market evidence. If quoted market prices were not available, the fair value was based upon the net present value of the future cash flow using the forward interest rate yield curve in effect at respective year-ends. At January 30, 2016, the fair value of total debt was $12,344 compared to a carrying value of $11,396. At January 31, 2015, the fair value of total debt was $12,378 compared to a carrying value of $11,026.
Cash and Temporary Cash Investments, Store Deposits In-Transit, Receivables, Prepaid and Other Current Assets, Trade Accounts Payable, Accrued Salaries and Wages and Other Current Liabilities
The carrying amounts of these items approximated fair value.
Other Assets
The fair values of these investments were estimated based on quoted market prices for those or similar investments, or estimated cash flows, if appropriate. At January 30, 2016 and January 31, 2015, the carrying and fair value of long-term investments for which fair value is determinable was $128 and $133, respectively. At January 30, 2016 and January 31, 2015, the carrying value of notes receivable for which fair value is determinable was $145 and $98, respectively.
9. ACCUMULATED OTHER COMPREHENSIVE INCOME (LOSS)
The following table represents the changes in AOCI by component for the years ended January 31, 2015 and January 30, 2016:
| Cash Flow Hedging Activities(1) | Available for sale Securities(1) | Pension and Postretirement Defined Benefit Plans(1) | Total(1) | ||||||||||||
| Balance at February 1, 2014 | $ (25 | ) | $12 | $(451 | ) | $(464 | ) | ||||||||
| OCI before reclassifications(2) | (25 | ) | 5 | (351 | ) | (371 | ) | ||||||||
| Amounts reclassified out of AOCI(3) | 1 | — | 22 | 23 | |||||||||||
| Net current-period OCI | (24 | ) | 5 | (329 | ) | (348 | ) | ||||||||
| Balance at January 31, 2015 | (49 | ) | 17 | (780 | ) | (812 | ) | ||||||||
| OCI before reclassifications(2) | (3 | ) | 3 | 78 | 78 | ||||||||||
| Amounts reclassified out of AOCI(3) | 1 | — | 53 | 54 | |||||||||||
| Net current-period OCI | (2 | ) | 3 | 131 | 132 | ||||||||||
| Balance at January 30, 2016 | $ (51 | ) | $20 | $(649 | ) | $(680 | ) | ||||||||
A-56
The following table represents the items reclassified out of AOCI and the related tax effects for the years ended January 30, 2016, January 31, 2015 and February 1, 2014:
| For the year ended January 30, 2016 | For the year ended January 31, 2015 | For the year ended February 1, 2014 | ||||||||||||||||
| Gains on cash flow hedging activities | ||||||||||||||||||
| Amortization of unrealized gains and losses | ||||||||||||||||||
| on cash flow hedging activities(1) | $ | 1 | $ | 1 | $ | 2 | ||||||||||||
| Tax expense | — | — | (1 | ) | ||||||||||||||
| Net of tax | 1 | 1 | 1 | |||||||||||||||
| Pension and postretirement defined benefit | ||||||||||||||||||
| plan items | ||||||||||||||||||
| Amortization of amounts included in net | ||||||||||||||||||
| periodic pension expense(2) | 85 | 35 | 98 | |||||||||||||||
| Tax expense | (32 | ) | (13 | ) | (36 | ) | ||||||||||||
| Net of tax | 53 | 22 | 62 | |||||||||||||||
| Total reclassifications, net of tax | $ | 54 | $ | 23 | $ | 63 | ||||||||||||
10. LEASESAND LEASE-FINANCED TRANSACTIONS
While the Company’s current strategy emphasizes ownership of store real estate, the Company operates primarily in leased facilities. Lease terms generally range from 10 to 20 years with options to renew for varying terms. Terms of certain leases include escalation clauses, percentage rent based on sales or payment of executory costs such as property taxes, utilities or insurance and maintenance. Rent expense for leases with escalation clauses or other lease concessions are accounted for on a straight-line basis beginning with the earlier of the lease commencement date or the date the Company takes possession. Portions of certain properties are subleased to others for periods generally ranging from one to 20 years.
Rent expense (under operating leases) consists of:
| 2015 | 2014 | 2013 | ||||||||||||
| Minimum rentals | $ | 807 | $ | 795 | $ | 706 | ||||||||
| Contingent payments | 18 | 16 | 13 | |||||||||||
| Tenant income | (102 | ) | (104 | ) | (106 | ) | ||||||||
| Total rent expense | $ | 723 | $ | 707 | $ | 613 | ||||||||
A-57
Minimum annual rentals and payments under capital leases and lease-financed transactions for the five years subsequent to 2015 and in the aggregate are:
| Capital Leases | Operating Leases | Lease- Financed Transactions | |||||||||||||
| 2016 | $ | 103 | $ | 967 | $ | 7 | |||||||||
| 2017 | 72 | 922 | 7 | ||||||||||||
| 2018 | 62 | 853 | 8 | ||||||||||||
| 2019 | 57 | 774 | 8 | ||||||||||||
| 2020 | 52 | 674 | 9 | ||||||||||||
| Thereafter | 527 | 4,199 | 63 | ||||||||||||
| Total | $ | 873 | $ | 8,389 | $ | 102 | |||||||||
| Less estimated executory costs included in capital leases | — | ||||||||||||||
| Net minimum lease payments under capital leases | 873 | ||||||||||||||
| Less amount representing interest | 293 | ||||||||||||||
| Present value of net minimum lease payments under | |||||||||||||||
| capital leases | $ | 580 | |||||||||||||
Total future minimum rentals under noncancellable subleases at January 30, 2016 were $261.
11. EARNINGSPERCOMMONSHARE
Net earnings attributable to The Kroger Co. per basic common share equals net earnings attributable to The Kroger Co. less income allocated to participating securities divided by the weighted average number of common shares outstanding. Net earnings attributable to The Kroger Co. per diluted common share equals net earnings attributable to The Kroger Co. less income allocated to participating securities divided by the weighted average number of common shares outstanding, after giving effect to dilutive stock options. The following table provides a reconciliation of net earnings attributable to The Kroger Co. and shares used in calculating net earnings attributable to The Kroger Co. per basic common share to those used in calculating net earnings attributable to The Kroger Co. per diluted common share:
| For the year ended | For the year ended | For the year ended | ||||||||||||||||||||||
| January 30, 2016 | January 31, 2015 | February 1, 2014 | ||||||||||||||||||||||
| Earnings | Shares | Per | Earnings | Shares | Per | Earnings | Shares | Per | ||||||||||||||||
| (in millions, except | (Numer- | (Denomi- | Share | (Numer- | (Denomi- | Share | (Numer- | (Denomi- | Share | |||||||||||||||
| per share amounts) | ator) | nator) | Amount | ator) | nator) | Amount | ator) | nator) | Amount | |||||||||||||||
| Net earnings attributable to The Kroger Co. per basic common share | $2,021 | 966 | $2.09 | $1,711 | 981 | $1.74 | $1,507 | 1,028 | $1.47 | |||||||||||||||
| Dilutive effect of stock options | 14 | 12 | 12 | |||||||||||||||||||||
| Net earnings attributable to The Kroger Co. per diluted common share | $2,021 | 980 | $2.06 | $1,711 | 993 | $1.72 | $1,507 | 1,040 | $1.45 | |||||||||||||||
The Company had combined undistributed and distributed earnings to participating securities totaling $18, $17 and $12 in 2015, 2014 and 2013, respectively.
A-58
The Company had options outstanding for approximately 1.9 million, 4.6 million and 4.7 million, respectively, for the years ended January 30, 2016, January 31, 2015 and February 1, 2014, which were excluded from the computations of net earnings per diluted common share because their inclusion would have had an anti-dilutive effect on net earnings per diluted share.
12. STOCK OPTION PLANS
The Company grants options for common shares (“stock options”) to employees under various plans at an option price equal to the fair market value of the stock at the date of grant. The Company accounts for stock options under the fair value recognition provisions.Under this method, the Company recognizes compensation expense for all share-based payments granted. The Company recognizes share-based compensation expense, net of an estimated forfeiture rate, over the requisite service period of the award. Equity awards may be made at one of four meetings of its Board of Directors occurring shortly after the Company’s release of quarterly earnings. The 2015 primary grant was made in conjunction with the June meeting of the Company’s Board of Directors. Certain changes to the stock option compensation strategy were put into effect in 2015, which resulted in a reduction to the number of stock options granted in 2015, compared to 2014 and 2013.
Stock options typically expire 10 years from the date of grant. Stock options vest between one and five years from the date of grant. At January 30, 2016, approximately 37 million common shares were available for future option grants under these plans.
In addition to the stock options described above, the Company awards restricted stock to employees and non-employee directors under various plans. The restrictions on these awards generally lapse between one and five years from the date of the awards. The Company records expense for restricted stock awards in an amount equal to the fair market value of the underlying shares on the grant date of the award, over the period the awards lapse. As of January 30, 2016, approximately 21 million common shares were available under the 2008, 2011 and 2014 Long-Term Incentive Plans (the “Plans”) for future restricted stock awards or shares issued to the extent performance criteria are achieved. The Company has the ability to convert shares available for stock options under the Plans to shares available for restricted stock awards. Under the Plans, four shares available for option awards can be converted into one share available for restricted stock awards.
All awards become immediately exercisable upon certain changes of control of the Company.
Stock Options
Changes in options outstanding under the stock option plans are summarized below:
| Shares subject to option (in millions) | Weighted- average exercise price | |||||||||
| Outstanding, year-end 2012 | 53.0 | $ | 11.30 | |||||||
| Granted | 8.4 | $ | 18.84 | |||||||
| Exercised | (17.7 | ) | $ | 11.11 | ||||||
| Canceled or Expired | (0.4 | ) | $ | 12.74 | ||||||
| Outstanding, year-end 2013 | 43.3 | $ | 12.83 | |||||||
| Granted | 8.4 | $ | 24.71 | |||||||
| Exercised | (10.3 | ) | $ | 11.56 | ||||||
| Canceled or Expired | (0.6 | ) | $ | 15.56 | ||||||
| Outstanding, year-end 2014 | 40.8 | $ | 15.56 | |||||||
| Granted | 3.4 | $ | 38.40 | |||||||
| Exercised | (8.9 | ) | $ | 13.54 | ||||||
| Canceled or Expired | (0.4 | ) | $ | 19.98 | ||||||
| Outstanding, year-end 2015 | 34.9 | $ | 18.26 | |||||||
A-59
A summary of options outstanding, exercisable and expected to vest at January 30, 2016 follows:
| Number of shares | Weighted- average remaining contractual life | Weighted- average exercise price | Aggregate | |||||
| (in millions) | (in years) | (in millions) | ||||||
| Options Outstanding | 34.9 | 6.20 | $18.26 | 719 | ||||
| Options Exercisable | 21.4 | 5.05 | $14.24 | 526 | ||||
| Options Expected to Vest | 13.2 | 8.02 | $24.53 | 189 |
Restricted stock
Changes in restricted stock outstanding under the restricted stock plans are summarized below:
| Restricted shares outstanding (in millions) | Weighted- average grant-date fair value | |||||||||
| Outstanding, year-end 2012 | 8.6 | $ | 11.34 | |||||||
| Granted | 6.3 | $ | 18.84 | |||||||
| Lapsed | (5.1 | ) | $ | 11.49 | ||||||
| Canceled or Expired | (0.2 | ) | $ | 13.66 | ||||||
| Outstanding, year-end 2013 | 9.6 | $ | 16.16 | |||||||
| Granted | 6.1 | $ | 24.76 | |||||||
| Lapsed | (5.2 | ) | $ | 16.52 | ||||||
| Canceled or Expired | (0.3 | ) | $ | 18.67 | ||||||
| Outstanding, year-end 2014 | 10.2 | $ | 21.04 | |||||||
| Granted | 3.2 | $ | 38.34 | |||||||
| Lapsed | (5.4 | ) | $ | 21.49 | ||||||
| Canceled or Expired | (0.4 | ) | $ | 22.80 | ||||||
| Outstanding, year-end 2015 | 7.6 | $ | 28.01 | |||||||
The weighted-average grant date fair value of stock options granted during 2015, 2014 and 2013 was $9.78, $5.98 and $4.49, respectively. The fair value of each stock option grant was estimated on the date of grant using the Black-Scholes option-pricing model, based on the assumptions shown in the table below. The Black-Scholes model utilizes accounting judgment and financial estimates, including the term option holders are expected to retain their stock options before exercising them, the volatility of the Company’s share price over that expected term, the dividend yield over the term and the number of awards expected to be forfeited before they vest. Using alternative assumptions in the calculation of fair value would produce fair values for stock option grants that could be different than those used to record stock-based compensation expense in the Consolidated Statements of Operations. The increase in the fair value of the stock options granted during 2015, compared to 2014, resulted primarily from an increase in the Company’s share price, which decreased the expected dividend yield. The increase in the fair value of the stock options granted during 2014, compared to 2013, resulted primarily from an increase in the Company’s share price, which decreased the expected dividend yield, and an increase in the weighted average risk-free interest rate.
A-60
The following table reflects the weighted-average assumptions used for grants awarded to option holders:
| 2015 | 2014 | 2013 | ||||||
| Weighted average expected volatility | 24.07 | % | 25.29 | % | 26.34 | % | ||
| Weighted average risk-free interest rate | 2.12 | % | 2.06 | % | 1.87 | % | ||
| Expected dividend yield | 1.20 | % | 1.51 | % | 1.82 | % | ||
| Expected term (based on historical results) | 7.2 years | 6.6 years | 6.8 years | |||||
The weighted-average risk-free interest rate was based on the yield of a treasury note as of the grant date, continuously compounded, which matures at a date that approximates the expected term of the options. The dividend yield was based on our history and expectation of dividend payouts. Expected volatility was determined based upon historical stock volatilities; however, implied volatility was also considered. Expected term was determined based upon historical exercise and cancellation experience.
Total stock compensation recognized in 2015, 2014 and 2013 was $165, $155 and $107, respectively. Stock option compensation recognized in 2015, 2014 and 2013 was $31, $32 and $24, respectively. Restricted shares compensation recognized in 2015, 2014 and 2013 was $134, $123 and $83, respectively.
The total intrinsic value of options exercised was $217, $142 and $115 in 2015, 2014 and 2013, respectively. The total amount of cash received in 2015 by the Company from the exercise of options granted under share-based payment arrangements was $120. As of January 30, 2016, there was $206 of total unrecognized compensation expense remaining related to non-vested share-based compensation arrangements granted under the Company’s equity award plans. This cost is expected to be recognized over a weighted-average period of approximately two years. The total fair value of options that vested was $33, $26 and $20 in 2015, 2014 and 2013, respectively.
Shares issued as a result of stock option exercises may be newly issued shares or reissued treasury shares. Proceeds received from the exercise of options, and the related tax benefit, may be utilized to repurchase the Company’s common shares under a stock repurchase program adopted by the Company’s Board of Directors. During 2015, the Company repurchased approximately five million common shares in such a manner.
13. COMMITMENTSAND CONTINGENCIES
The Company continuously evaluates contingencies based upon the best available evidence.
The Company believes that allowances for loss have been provided to the extent necessary and that its assessment of contingencies is reasonable. To the extent that resolution of contingencies results in amounts that vary from the Company’s estimates, future earnings will be charged or credited.
The principal contingencies are described below:
Insurance — The Company’s workers’ compensation risks are self-insured in most states. In addition, other workers’ compensation risks and certain levels of insured general liability risks are based on retrospective premium plans, deductible plans, and self-insured retention plans. The liability for workers’ compensation risks is accounted for on a present value basis. Actual claim settlements and expenses incident thereto may differ from the provisions for loss. Property risks have been underwritten by a subsidiary and are all reinsured with unrelated insurance companies. Operating divisions and subsidiaries have paid premiums, and the insurance subsidiary has provided loss allowances, based upon actuarially determined estimates.
A-61
Litigation –Various claims and lawsuits arising in the normal course of business, including suits charging violations of certain antitrust, wage and hour, or civil rights laws, as well as product liability cases, are pending against the Company. Some of these suits purport or have been determined to be class actions and/or seek substantial damages. Any damages that may be awarded in antitrust cases will be automatically trebled. Although it is not possible at this time to evaluate the merits of all of these claims and lawsuits, nor their likelihood of success, the Company is of the belief that any resulting liability will not have a material effect on the Company’s financial position, results of operations, or cash flows.
The Company continually evaluates its exposure to loss contingencies arising from pending or threatened litigation and believes it has made provisions where it is reasonably possible to estimate and when an adverse outcome is probable. Nonetheless, assessing and predicting the outcomes of these matters involves substantial uncertainties. Management currently believes that the aggregate range of loss for the Company’s exposure is not material to the Company. It remains possible that despite management’s current belief, material differences in actual outcomes or changes in management’s evaluation or predictions could arise that could have a material adverse effect on the Company’s financial condition, results of operations, or cash flows.
Assignments – The Company is contingently liable for leases that have been assigned to various third parties in connection with facility closings and dispositions. The Company could be required to satisfy the obligations under the leases if any of the assignees is unable to fulfill its lease obligations. Due to the wide distribution of the Company’s assignments among third parties, and various other remedies available, the Company believes the likelihood that it will be required to assume a material amount of these obligations is remote.
14. STOCK
Preferred Shares
The Company has authorized five million shares of voting cumulative preferred shares; two million shares were available for issuance at January 30, 2016. The shares have a par value of $100 per share and are issuable in series.
Common Shares
The Company has authorized two billion common shares, $1 par value per share.
On June 25, 2015, the Company’s Board of Directors approved a two-for-one stock split of The Kroger Co.’s common shares in the form of a 100% stock dividend, which was effective July 13, 2015. All share and per share amounts in the Company’s Consolidated Financial Statements and related notes have been retroactively adjusted to reflect the stock split for all periods presented.
Common Stock Repurchase Program
The Company maintains stock repurchase programs that comply with Rule 10b5-1 of the Securities Exchange Act of 1934 to allow for the orderly repurchase of The Kroger Co. common shares, from time to time. The Company made open market purchases totaling $500, $1,129 and $338 under these repurchase programs in 2015, 2014 and 2013, respectively. In addition to these repurchase programs, in December 1999, the Company began a program to repurchase common shares to reduce dilution resulting from its employee stock option plans. This program is solely funded by proceeds from stock option exercises and the related tax benefit. The Company repurchased approximately $203, $154 and $271 under the stock option program during 2015, 2014 and 2013, respectively.
A-62
15. COMPANY-SPONSORED BENEFIT PLANS
The Company administers non-contributory defined benefit retirement plans for some non-union employees and union-represented employees as determined by the terms and conditions of collective bargaining agreements. These include several qualified pension plans (the “Qualified Plans”) and non-qualified pension plans (the “Non-Qualified Plans”). The Non-Qualified Plans pay benefits to any employee that earns in excess of the maximum allowed for the Qualified Plans by Section 415 of the Internal Revenue Code. The Company only funds obligations under the Qualified Plans. Funding for the Company-sponsored pension plans is based on a review of the specific requirements and on evaluation of the assets and liabilities of each plan.
In addition to providing pension benefits, the Company provides certain health care benefits for retired employees. The majority of the Company’s employees may become eligible for these benefits if they reach normal retirement age while employed by the Company. Funding of retiree health care benefits occurs as claims or premiums are paid.
The Company recognizes the funded status of its retirement plans on the Consolidated Balance Sheets. Actuarial gains or losses, prior service costs or credits and transition obligations that have not yet been recognized as part of net periodic benefit cost are required to be recorded as a component of AOCI. All plans are measured as of the Company’s fiscal year end.
Amounts recognized in AOCI as of January 30, 2016 and January 31, 2015 consists of the following (pre-tax):
| Pension Benefits | Other Benefits | Total | ||||||||||||||||||||||||
| 2015 | 2014 | 2015 | 2014 | 2015 | 2014 | |||||||||||||||||||||
| Net actuarial loss (gain) | $ | 1,213 | $ | 1,398 | $ | (121 | ) | $ | (89 | ) | $ | 1,092 | $ | 1,309 | ||||||||||||
| Prior service cost (credit) | 1 | 1 | (66 | ) | (75 | ) | (65 | ) | (74 | ) | ||||||||||||||||
| Total | $ | 1,214 | $ | 1,399 | $ | (187 | ) | $ | (164 | ) | $ | 1,027 | $ | 1,235 | ||||||||||||
Amounts in AOCI expected to be recognized as components of net periodic pension or postretirement benefit costs in the next fiscal year are as follows (pre-tax):
| Pension Benefits | Other Benefits | Total | |||||||||||||||
| 2016 | 2016 | 2016 | |||||||||||||||
| Net actuarial loss (gain) | $ | 62 | $ | (9 | ) | $ | 53 | ||||||||||
| Prior service credit | — | (8 | ) | (8 | ) | ||||||||||||
| Total | $ | 62 | $ | (17 | ) | $ | 45 | ||||||||||
Other changes recognized in other comprehensive income in 2015, 2014 and 2013 were as follows (pre-tax):
| Pension Benefits | Other Benefits | Total | ||||||||||||||||||||||||||||||||||
| 2015 | 2014 | 2013 | 2015 | 2014 | 2013 | 2015 | 2014 | 2013 | ||||||||||||||||||||||||||||
| Incurred net actuarial loss (gain) | $ | (83 | ) | $ | 590 | $ | (243 | ) | $ | (39 | ) | $ | 14 | $ | (97 | ) | $ | (122 | ) | $ | 604 | $ | (340 | ) | ||||||||||||
| Amortization of prior service credit | — | — | — | 11 | 7 | 4 | 11 | 7 | 4 | |||||||||||||||||||||||||||
| Amortization of net actuarial gain (loss) | (102 | ) | (50 | ) | (102 | ) | 7 | 8 | — | (95 | ) | (42 | ) | (102 | ) | |||||||||||||||||||||
| Other | — | — | — | (2 | ) | (47 | ) | (30 | ) | (2 | ) | (47 | ) | (30 | ) | |||||||||||||||||||||
| Total recognized in other | ||||||||||||||||||||||||||||||||||||
| comprehensive income (loss) | (185 | ) | 540 | (345 | ) | (23 | ) | (18 | ) | (123 | ) | (208 | ) | 522 | (468 | ) | ||||||||||||||||||||
| Total recognized in net periodic benefit cost | ||||||||||||||||||||||||||||||||||||
| and other comprehensive income | $ | (82 | ) | $ | 595 | $ | (271 | ) | $ | (22 | ) | $ | (9 | ) | $ | (95 | ) | $ | (104 | ) | $ | 586 | $ | (366 | ) | |||||||||||
A-63
Information with respect to change in benefit obligation, change in plan assets, the funded status of the plans recorded in the Consolidated Balance Sheets, net amounts recognized at the end of fiscal years, weighted average assumptions and components of net periodic benefit cost follow:
| Pension Benefits | ||||||||||||||||||||||||||||||||||||
| Other | ||||||||||||||||||||||||||||||||||||
| Qualified Plans | Non-Qualified Plans | Benefits | ||||||||||||||||||||||||||||||||||
| 2015 | 2014 | 2015 | 2014 | 2015 | 2014 | |||||||||||||||||||||||||||||||
| Change in benefit obligation: | ||||||||||||||||||||||||||||||||||||
| Benefit obligation at beginning of fiscal year | $ | 4,102 | $ | 3,509 | $ | 304 | $ | 263 | $ | 275 | $ | 294 | ||||||||||||||||||||||||
| Service cost | 62 | 48 | 3 | 3 | 10 | 11 | ||||||||||||||||||||||||||||||
| Interest cost | 154 | 169 | 12 | 13 | 9 | 13 | ||||||||||||||||||||||||||||||
| Plan participants’ contributions | — | — | — | — | 10 | 11 | ||||||||||||||||||||||||||||||
| Actuarial (gain) loss | (411 | ) | 539 | (17 | ) | 40 | (39 | ) | 14 | |||||||||||||||||||||||||||
| Benefits paid | (162 | ) | (163 | ) | (17 | ) | (15 | ) | (19 | ) | (21 | ) | ||||||||||||||||||||||||
| Other | (17 | ) | — | 3 | — | (2 | ) | (47 | ) | |||||||||||||||||||||||||||
| Assumption of Roundy’s benefit obligation | 194 | — | 2 | — | — | — | ||||||||||||||||||||||||||||||
| Benefit obligation at end of fiscal year | $ | 3,922 | $ | 4,102 | $ | 290 | $ | 304 | $ | 244 | $ | 275 | ||||||||||||||||||||||||
| Change in plan assets: | ||||||||||||||||||||||||||||||||||||
| Fair value of plan assets at beginning of | ||||||||||||||||||||||||||||||||||||
| fiscal year | $ | 3,189 | $ | 3,135 | $ | — | $ | — | $ | — | $ | — | ||||||||||||||||||||||||
| Actual return on plan assets | (124 | ) | 217 | — | — | — | — | |||||||||||||||||||||||||||||
| Employer contributions | 5 | — | 17 | 15 | 9 | 10 | ||||||||||||||||||||||||||||||
| Plan participants’ contributions | — | — | — | — | 10 | 11 | ||||||||||||||||||||||||||||||
| Benefits paid | (162 | ) | (163 | ) | (17 | ) | (15 | ) | (19 | ) | (21 | ) | ||||||||||||||||||||||||
| Other | (18 | ) | — | — | — | — | — | |||||||||||||||||||||||||||||
| Assumption of Roundy’s plan assets | 155 | — | — | — | — | — | ||||||||||||||||||||||||||||||
| Fair value of plan assets at end of fiscal year | $ | 3,045 | $ | 3,189 | $ | — | $ | — | $ | — | $ | — | ||||||||||||||||||||||||
| Funded status at end of fiscal year | $ | (877 | ) | $ | (913 | ) | $ | (290 | ) | $ | (304 | ) | $ | (244 | ) | $ | (275 | ) | ||||||||||||||||||
| Net liability recognized at end of fiscal year | $ | (877 | ) | $ | (913 | ) | $ | (290 | ) | $ | (304 | ) | $ | (244 | ) | $ | (275 | ) | ||||||||||||||||||
As of January 30, 2016 and January 31, 2015, other current liabilities include $31 and $29, respectively, of net liability recognized for the above benefit plans.
As of January 30, 2016 and January 31, 2015, pension plan assets do not include common shares of The Kroger Co.
| Pension Benefits | Other Benefits | |||||||||||
| Weighted average assumptions | 2015 | 2014 | 2013 | 2015 | 2014 | 2013 | ||||||
| Discount rate – Benefit obligation | 4.62% | 3.87% | 4.99% | 4.44% | 3.74% | 4.68% | ||||||
| Discount rate – Net periodic benefit cost | 3.87% | 4.99% | 4.29% | 3.74% | 4.68% | 4.11% | ||||||
| Expected long-term rate of return on | ||||||||||||
| plan assets | 7.44% | 7.44% | 8.50% | |||||||||
| Rate of compensation increase – | ||||||||||||
| Net periodic benefit cost | 2.85% | 2.86% | 2.77% | |||||||||
| Rate of compensation increase – | ||||||||||||
| Benefit obligation | 2.71% | 2.85% | 2.86% | |||||||||
A-64
The Company’s discount rate assumptions were intended to reflect the rates at which the pension benefits could be effectively settled. They take into account the timing and amount of benefits that would be available under the plans. The Company’s policy is to match the plan’s cash flows to that of a hypothetical bond portfolio whose cash flow from coupons and maturities match the plan’s projected benefit cash flows. The discount rates are the single rates that produce the same present value of cash flows. The selection of the 4.62% and 4.44% discount rates as of year-end 2015 for pension and other benefits, respectively, represents the hypothetical bond portfolio using bonds with an AA or better rating constructed with the assistance of an outside consultant. A 100 basis point increase in the discount rate would decrease the projected pension benefit obligation as of January 31, 2016, by approximately $438.
To determine the expected rate of return on pension plan assets held by the Company for 2015, the Company considered current and forecasted plan asset allocations as well as historical and forecasted rates of return on various asset categories. In 2015 and 2014, the Company decreased the assumed pension plan investment return rate to 7.44% compared to 8.50% in 2013. The Company pension plan’s average rate of return was 6.47% for the 10 calendar years ended December 31, 2015, net of all investment management fees and expenses. The value of all investments in the Qualified Plans during the calendar year ending December 31, 2015 decreased 0.80%, net of investment management fees and expenses. For the past 20 years, the Company’s average annual rate of return has been 7.99%. Based on the above information and forward looking assumptions for investments made in a manner consistent with the Company’s target allocations, the Company believes a 7.44% rate of return assumption is reasonable.
The Company calculates its expected return on plan assets by using the market-related value of plan assets. The market-related value of plan assets is determined by adjusting the actual fair value of plan assets for gains or losses on plan assets. Gains or losses represent the difference between actual and expected returns on plan investments for each plan year. Gains or losses on plan assets are recognized evenly over a five year period. Using a different method to calculate the market-related value of plan assets would provide a different expected return on plan assets.
On January 31, 2015, the Company adopted new mortality tables based on mortality experience and assumptions for generational mortality improvement in calculating the Company’s 2015 and 2014 Company sponsored benefit plans obligations. The tables assume an improvement in life expectancy and increase our current year benefit obligation and future net periodic benefit cost. The Company used the RP-2000 projected 2021 mortality table in calculating the Company’s 2013 Company sponsored benefit plans obligations and the 2014 and 2013 Company-sponsored net periodic benefit cost.
The funded status increased in 2015, compared to 2014, due primarily to an increase in the discount rate and a decrease in plan assets.
The following table provides the components of the Company’s net periodic benefit costs for 2015, 2014 and 2013:
| Pension Benefits | |||||||||||||||||||||||||||||||||||||||||||||
| Non-Qualified | |||||||||||||||||||||||||||||||||||||||||||||
| Qualified Plans | Plans | Other Benefits | |||||||||||||||||||||||||||||||||||||||||||
| 2015 | 2014 | 2013 | 2015 | 2014 | 2013 | 2015 | 2014 | 2013 | |||||||||||||||||||||||||||||||||||||
| Components of net periodic benefit cost: | |||||||||||||||||||||||||||||||||||||||||||||
| Service cost | $ | 62 | $ | 48 | $ | 40 | $ | 3 | $ | 3 | $ | 3 | $ | 10 | $ | 11 | $ | 17 | |||||||||||||||||||||||||||
| Interest cost | 154 | 169 | 144 | 12 | 13 | 9 | 9 | 13 | 15 | ||||||||||||||||||||||||||||||||||||
| Expected return on plan assets | (230 | ) | (228 | ) | (224 | ) | — | — | — | — | — | — | |||||||||||||||||||||||||||||||||
| Amortization of: | |||||||||||||||||||||||||||||||||||||||||||||
| Prior service credit | — | — | — | — | — | — | (11 | ) | (7 | ) | (4 | ) | |||||||||||||||||||||||||||||||||
| Actuarial (gain) loss | 93 | 46 | 93 | 9 | 4 | 9 | (7 | ) | (8 | ) | — | ||||||||||||||||||||||||||||||||||
| Net periodic benefit cost | $ | 79 | $ | 35 | $ | 53 | $ | 24 | $ | 20 | $ | 21 | $ | 1 | $ | 9 | $ | 28 | |||||||||||||||||||||||||||
A-65
The following table provides the projected benefit obligation (“PBO”), accumulated benefit obligation (“ABO”) and the fair value of plan assets for all Company-sponsored pension plans.
| Non-Qualified | |||||||||||||||
| Qualified Plans | Plans | ||||||||||||||
| 2015 | 2014 | 2015 | 2014 | ||||||||||||
| PBO at end of fiscal year | $ | 3,922 | $ | 4,102 | $ | 290 | $ | 304 | |||||||
| ABO at end of fiscal year | $ | 3,786 | $ | 3,947 | $ | 280 | $ | 297 | |||||||
| Fair value of plan assets at end of year | $ | 3,045 | $ | 3,189 | $ | — | $ | — | |||||||
The following table provides information about the Company’s estimated future benefit payments.
| Pension | Other | |||||||||
| Benefits | Benefits | |||||||||
| 2016 | $ | 234 | $ | 15 | ||||||
| 2017 | $ | 221 | $ | 16 | ||||||
| 2018 | $ | 230 | $ | 17 | ||||||
| 2019 | $ | 238 | $ | 18 | ||||||
| 2020 | $ | 248 | $ | 19 | ||||||
| 2021 – 2025 | $ | 1,346 | $ | 105 | ||||||
The following table provides information about the weighted average target and actual pension plan asset allocations.
| Target allocations | Actual Allocations | ||||||||
| 2015 | 2015 | 2014 | |||||||
| Pension plan asset allocation | |||||||||
| Global equity securities | 16.0 | % | 14.9 | % | 13.4 | % | |||
| Emerging market equity securities | 5.4 | 5.2 | 5.8 | ||||||
| Investment grade debt securities | 13.1 | 11.3 | 11.2 | ||||||
| High yield debt securities | 12.1 | 11.9 | 12.5 | ||||||
| Private equity | 5.2 | 7.4 | 6.6 | ||||||
| Hedge funds | 34.6 | 36.0 | 37.5 | ||||||
| Real estate | 3.4 | 3.9 | 3.5 | ||||||
| Other | 10.2 | 9.4 | 9.5 | ||||||
| Total | 100.0 | % | 100.0 | % | 100.0 | % | |||
Investment objectives, policies and strategies are set by the Pension Investment Committees (the “Committees”) appointed by the CEO. The primary objectives include holding and investing the assets and distributing benefits to participants and beneficiaries of the pension plans. Investment objectives have been established based on a comprehensive review of the capital markets and each underlying plan’s current and projected financial requirements. The time horizon of the investment objectives is long-term in nature and plan assets are managed on a going-concern basis.
Investment objectives and guidelines specifically applicable to each manager of assets are established and reviewed annually. Derivative instruments may be used for specified purposes, including rebalancing exposures to certain asset classes. Any use of derivative instruments for a purpose or in a manner not specifically authorized is prohibited, unless approved in advance by the Committees.
A-66
The current target allocations shown represent the 2015 targets that were established in 2014. The Company will rebalance by liquidating assets whose allocation materially exceeds target, if possible, and investing in assets whose allocation is materially below target. If markets are illiquid, the Company may not be able to rebalance to target quickly. To maintain actual asset allocations consistent with target allocations, assets are reallocated or rebalanced periodically. In addition, cash flow from employer contributions and participant benefit payments can be used to fund underweight asset classes and divest overweight asset classes, as appropriate. The Company expects that cash flow will be sufficient to meet most rebalancing needs.
The Company is not required and does not expect to make any contributions to the Qualified Plans in 2016. If the Company does make any contributions in 2016, the Company expects these contributions will decrease its required contributions in future years. Among other things, investment performance of plan assets, the interest rates required to be used to calculate the pension obligations, and future changes in legislation, will determine the amounts of any contributions. The Company expects 2016 expense for Company-sponsored pension plans to be approximately $80. In addition, the Company expects 401(k) retirement savings account plans cash contributions and expense from automatic and matching contributions to participants to be approximately $200 in 2016.
Assumed health care cost trend rates have a significant effect on the amounts reported for the health care plans. The Company used a 6.90% initial health care cost trend rate, which is assumed to decrease on a linear basis to a 4.50% ultimate health care cost trend rate in 2028, to determine its expense. A one-percentage-point change in the assumed health care cost trend rates would have the following effects:
| 1% Point Increase | 1% Point Decrease | ||||||||||
| Effect on total of service and interest cost components | $ | 3 | $ | (2 | ) | ||||||
| Effect on postretirement benefit obligation | $ | 23 | $ | (20 | ) | ||||||
The following tables set forth by level, within the fair value hierarchy, the Qualified Plans’ assets at fair value as of January 30, 2016 and January 31, 2015:
Assets at Fair Value as of January 30, 2016
Quoted | Significant Other Observable Inputs (Level 2) | Significant Unobservable Inputs (Level 3) | Total | |||||||||||||||
| Cash and cash equivalents | $ | 27 | $ | — | $ | — | $ | 27 | ||||||||||
| Corporate Stocks | 231 | — | — | 231 | ||||||||||||||
| Corporate Bonds | — | 76 | — | 76 | ||||||||||||||
| U.S. Government Securities | — | 75 | — | 75 | ||||||||||||||
| Mutual Funds/Collective Trusts | 89 | 861 | 40 | 990 | ||||||||||||||
| Partnerships/Joint Ventures | — | 118 | — | 118 | ||||||||||||||
| Hedge Funds | — | — | 1,104 | 1,104 | ||||||||||||||
| Private Equity | — | — | 225 | 225 | ||||||||||||||
| Real Estate | — | — | 103 | 103 | ||||||||||||||
| Other | — | 96 | — | 96 | ||||||||||||||
| Total | $ | 347 | $ | 1,226 | $ | 1,472 | $ | 3,045 | ||||||||||
A-67
Assets at Fair Value as of January 31, 2015
| Quoted Prices in Active Markets for Identical Assets (Level 1) | Significant Other Observable Inputs (Level 2) | Significant Unobservable Inputs (Level 3) | Total | |||||||||||||||
| Cash and cash equivalents | $ | 73 | $ | — | $ | — | $ | 73 | ||||||||||
| Corporate Stocks | 294 | — | — | 294 | ||||||||||||||
| Corporate Bonds | — | 80 | — | 80 | ||||||||||||||
| U.S. Government Securities | — | 78 | — | 78 | ||||||||||||||
| Mutual Funds/Collective Trusts | 123 | 503 | 40 | 666 | ||||||||||||||
| Partnerships/Joint Ventures | — | 468 | — | 468 | ||||||||||||||
| Hedge Funds | — | — | 1,158 | 1,158 | ||||||||||||||
| Private Equity | — | — | 210 | 210 | ||||||||||||||
| Real Estate | — | — | 105 | 105 | ||||||||||||||
| Other | — | 57 | — | 57 | ||||||||||||||
| Total | $ | 490 | $ | 1,186 | $ | 1,513 | $ | 3,189 | ||||||||||
For measurements using significant unobservable inputs (Level 3) during 2015 and 2014, a reconciliation of the beginning and ending balances is as follows:
| Hedge Funds | Private Equity | Real Estate | Collective Trusts | ||||||||||||||||||||
| Ending balance, February 1, 2014 | $ | 1,073 | $ | 243 | $ | 96 | $ | 39 | |||||||||||||||
| Contributions into Fund | 220 | 47 | 17 | — | |||||||||||||||||||
| Realized gains | 47 | 35 | 14 | 1 | |||||||||||||||||||
| Unrealized gains (losses) | 18 | (1 | ) | 4 | — | ||||||||||||||||||
| Distributions | (257 | ) | (54 | ) | (25 | ) | — | ||||||||||||||||
| Reclass(1) | 58 | (58 | ) | — | — | ||||||||||||||||||
| Other | (1 | ) | (2 | ) | (1 | ) | — | ||||||||||||||||
| Ending balance, January 31, 2015 | 1,158 | 210 | 105 | 40 | |||||||||||||||||||
| Contributions into Fund | 239 | 47 | 13 | — | |||||||||||||||||||
| Realized gains | 49 | 23 | 9 | — | |||||||||||||||||||
| Unrealized (losses) gains | (49 | ) | (3 | ) | 3 | — | |||||||||||||||||
| Distributions | (294 | ) | (50 | ) | (26 | ) | — | ||||||||||||||||
| Other | 1 | (2 | ) | (1 | ) | — | |||||||||||||||||
| Ending balance, January 30, 2016 | $ | 1,104 | $ | 225 | $ | 103 | $ | 40 | |||||||||||||||
See Note 8 for a discussion of the levels of the fair value hierarchy. The assets’ fair value measurement level above is based on the lowest level of any input that is significant to the fair value measurement.
A-68
The following is a description of the valuation methods used for the Qualified Plans’ assets measured at fair value in the above tables:
| |
| |
| |
| |
| |
| |
|
A-69
| |
|
The Company contributed and expensed $196, $177 and $148 to employee 401(k) retirement savings accounts in 2015, 2014 and 2013, respectively. The 401(k) retirement savings account plans provide to eligible employees both matching contributions and automatic contributions from the Company based on participant contributions, compensation as defined by the plan, and length of service.
The Company also administers other defined contribution plans for eligible employees. The cost of these plans was $5 for 2015, 2014 and 2013.
16. Multi-Employer Pension Plans
The Company contributes to various multi-employer pension plans, including the UFCW Consolidated Pension Plan, based on obligations arising from collective bargaining agreements. The Company is designated as the named fiduciary of the UFCW Consolidated Pension Plan and has sole investment authority over these assets. These plans provide retirement benefits to participants based on their service to contributing employers. The benefits are paid from assets held in trust for that purpose. Trustees are appointed in equal number by employers and unions. The trustees typically are responsible for determining the level of benefits to be provided to participants as well as for such matters as the investment of the assets and the administration of the plans.
In 2015, the Company contributed $190 to the UFCW Consolidated Pension Plan. The Company had previously accrued $60 of the total contributions at January 31, 2015 and recorded expense for the remaining $130 at the time of payment in 2015.
In 2014, the Company incurred a charge of $56 (after-tax) related to commitments and withdrawal liabilities associated with the restructuring of pension plan agreements, of which $15 was contributed to the UFCW Consolidated Pension Plan in 2014.
Refer to Note 19 for additional details on the effect of certain contributions on quarterly results for 2015 and 2014.
The Company recognizes expense in connection with its multi-employer pension plans as contributions are funded, or when commitments are made. The Company made contributions to multi-employer funds of $426 in 2015, $297 in 2014 and $228 in 2013.
A-70
The risks of participating in multi-employer pension plans are different from the risks of participating in single-employer pension plans in the following respects:
The Company’s participation in multi-employer plans is outlined in the following tables. The EIN / Pension Plan Number column provides the Employer Identification Number (“EIN”) and the three-digit pension plan number. The most recent Pension Protection Act Zone Status available in 2015 and 2014 is for the plan’s year-end at December 31, 2014 and December 31, 2013, respectively. Among other factors, generally, plans in the red zone are less than 65 percent funded, plans in the yellow zone are less than 80 percent funded and plans in the green zone are at least 80 percent funded. The FIP/ RP Status Pending / Implemented Column indicates plans for which a funding improvement plan (“FIP”) or a rehabilitation plan (“RP”) is either pending or has been implemented. Unless otherwise noted, the information for these tables was obtained from the Forms 5500 filed for each plan’s year-end at December 31, 2014 and December 31, 2013. The multi-employer contributions listed in the table below are the Company’s multi-employer contributions made in fiscal years 2015, 2014 and 2013.
A-71
The following table contains information about the Company’s multi-employer pension plans:
| Pension | |||||||||||||||||||
| Protection | FIP/RP | ||||||||||||||||||
| Act Zone | Status | Multi-Employer | |||||||||||||||||
| EIN / Pension | Status | Pending/ | Contributions | Surcharge | |||||||||||||||
| Pension Fund | Plan Number | 2015 | 2014 | Implemented | 2015 | 2014 | 2013 | Imposed(6) | |||||||||||
| SO CA UFCW Unions & Food | |||||||||||||||||||
| Employers Joint Pension | |||||||||||||||||||
| Trust Fund(1) (2) | 95-1939092 - 001 | Red | Red | Implemented | $ | 55 | $ | 48 | $ | 45 | No | ||||||||
| Desert States Employers | |||||||||||||||||||
| & UFCW Unions | |||||||||||||||||||
| Pension Plan(1) | 84-6277982 - 001 | Green | Green | No | 18 | 21 | 23 | No | |||||||||||
| Sound Retirement Trust | |||||||||||||||||||
| (formerly Retail Clerks | |||||||||||||||||||
| Pension Plan)(1) (3) | 91-6069306 - 001 | Red | Red | Implemented | 17 | 15 | 13 | No | |||||||||||
| Rocky Mountain UFCW | |||||||||||||||||||
| Unions and Employers | |||||||||||||||||||
| Pension Plan(1) | 84-6045986 - 001 | Green | Green | No | 17 | 17 | 17 | No | |||||||||||
| Oregon Retail Employees | |||||||||||||||||||
| Pension Plan(1) | 93-6074377 - 001 | Green | Red | No | 9 | 7 | 7 | No | |||||||||||
| Bakery and Confectionary Union | |||||||||||||||||||
| & Industry International | |||||||||||||||||||
| Pension Fund(1) | 52-6118572 - 001 | Red | Red | Implemented | 11 | 11 | 12 | No | |||||||||||
| Washington Meat Industry | |||||||||||||||||||
| Pension Trust(1) (4) (5) | 91-6134141 - 001 | Red | Red | Implemented | — | 1 | 3 | No | |||||||||||
| Retail Food Employers & UFCW | |||||||||||||||||||
| Local 711 Pension(1) | 51-6031512 - 001 | Red | Red | Implemented | 9 | 9 | 8 | No | |||||||||||
| Denver Area Meat Cutters | |||||||||||||||||||
| and Employers | |||||||||||||||||||
| Pension Plan(1) | 84-6097461 - 001 | Green | Green | No | 7 | 8 | 8 | No | |||||||||||
| United Food & Commercial | |||||||||||||||||||
| Workers Intl Union – Industry | |||||||||||||||||||
| Pension Fund(1) (4) | 51-6055922 - 001 | Green | Green | No | 35 | 33 | 33 | No | |||||||||||
| Western Conference of | |||||||||||||||||||
| Teamsters Pension Plan | 91-6145047 - 001 | Green | Green | No | 31 | 30 | 31 | No | |||||||||||
| Central States, Southeast | |||||||||||||||||||
| & Southwest Areas | |||||||||||||||||||
| Pension Plan | 36-6044243 - 001 | Red | Red | Implemented | 16 | 15 | 15 | No | |||||||||||
| UFCW Consolidated | |||||||||||||||||||
| Pension Plan(1) | 58-6101602 - 001 | Green | Green | No | 190 | 70 | — | No | |||||||||||
| Other | 11 | 12 | 13 | ||||||||||||||||
| Total Contributions | $ | 426 | $ | 297 | $ | 228 | |||||||||||||
A-72
The following table describes (a) the expiration date of the Company’s collective bargaining agreements and (b) the expiration date of the Company’s most significant collective bargaining agreements for each of the material multi-employer funds in which the Company participates.
| Expiration Date | Most Significant Collective | |||||
| of Collective | Bargaining Agreements(1) | |||||
| Bargaining | (not in millions) | |||||
| Pension Fund | Agreements | Count | Expiration | |||
| SO CA UFCW Unions & Food Employers Joint | March 2016 to | March 2016 to | ||||
| Pension Trust Fund | June 2017 | 2 | June 2017 | |||
| March 2016 to | April 2016 to | |||||
| UFCW Consolidated Pension Plan | August 2020 | 8 | August 2020 | |||
| Desert States Employers & UFCW Unions | October 2016 to | |||||
| Pension Plan | June 2018 | 1 | October 2016 | |||
| Sound Retirement Trust (formerly Retail | April 2016 to | May 2016 to | ||||
| Clerks Pension Plan) | January 2018 | 2 | August 2016 | |||
| Rocky Mountain UFCW Unions and | January 2019 to | |||||
| Employers Pension Plan | February 2019 | 1 | January 2019 | |||
| August 2015(2)to | August 2015(2)to | |||||
| Oregon Retail Employees Pension Plan | April 2017 | 3 | June 2016 | |||
| Bakery and Confectionary Union & Industry | June 2016 to July | August 2016 to | ||||
| International Pension Fund | 2018 | 4 | July 2018 | |||
| Retail Food Employers & | April 2017 to | |||||
| UFCW Local 711 Pension | November 2019 | 1 | March 2019 | |||
| Denver Area Meat Cutters and | January 2019 to | |||||
| Employers Pension Plan | February 2019 | 1 | January 2019 | |||
| United Food & Commercial Workers Intl Union – | March 2014(2)to | March 2017 to | ||||
| Industry Pension Fund | April 2019 | 2 | April 2019 | |||
| April 2017 to | July 2017 to | |||||
| Western Conference of Teamsters Pension Plan | September 2020 | 5 | September 2020 | |||
| Central States, Southeast & Southwest | September 2017 to | September 2017 to | ||||
| Areas Pension Plan | November 2018 | 3 | November 2018 | |||
A-73
Based on the most recent information available to it, the Company believes the present value of actuarial accrued liabilities in most of these multi-employer plans substantially exceeds the value of the assets held in trust to pay benefits. Moreover, if the Company were to exit certain markets or otherwise cease making contributions to these funds, the Company could trigger a substantial withdrawal liability. Any adjustment for withdrawal liability will be recorded when it is probable that a liability exists and can be reasonably estimated.
The Company also contributes to various other multi-employer benefit plans that provide health and welfare benefits to active and retired participants. Total contributions made by the Company to these other multi-employer health and welfare plans were approximately $1,192 in 2015, $1,200 in 2014 and $1,100 in 2013.
17. Recently Adopted Accounting Standards
In 2015, the Financial Accounting Standards Board (“FASB”) amended Accounting Standards Codification 835, “Interest-Imputation of Interest.” The amendment simplifies the presentation of debt issuance costs related to a recognized debt liability by requiring it be presented in the balance sheet as a direct deduction from the carrying amount of that debt liability, consistent with debt discounts. This amendment became effective for the Company beginning February 1, 2015, and was adopted retrospectively in accordance with the standard. The adoption of this amendment resulted in amounts previously reported in other assets to now be reported within long-term debt including obligations under capital leases and financing obligations in the Consolidated Balance Sheets. These amounts were not material to the prior year. The adoption of this amendment did not have an effect on the Company’s Consolidated Statements of Operations.
18. Recently Issued Accounting Standards
In May 2014, the FASB issued Accounting Standards Update (“ASU”) 2014-09, “Revenue from Contracts with Customers,” which provides guidance for revenue recognition. The standard’s core principle is that a company will recognize revenue when it transfers promised goods or services to customers in an amount that reflects the consideration to which the company expects to be entitled in exchange for those goods or services. Per ASU 2015-14, “Deferral of Effective Date,” this guidance will be effective for the Company in the first quarter of its fiscal year ending February 2, 2019. Early adoption is permitted as of the first quarter of the Company’s fiscal year ending February 3, 2018. The Company is currently in the process of evaluating the effect of adoption of this ASU on the Company’s Consolidated Financial Statements.
In April 2015, the FASB issued ASU 2015-04, “Retirement Benefits (Topic 715): Practical Expedient for the Measurement Date of an Employer’s Defined Benefit Obligation and Plan Assets.” This amendment permits an entity to measure defined benefit plan assets and obligations using the month end that is closest to the entity’s fiscal year end for all plans. This guidance will be effective for the Company in the fiscal year ending January 28, 2017. The implementation of this amendment will not have an effect on the Company’s Consolidated Statements of Operations, and will not have a significant effect on the Company’s Consolidated Balance Sheets.
In April 2015, the FASB issued ASU 2015-07, “Fair Value Measurement (Topic 820): Disclosures for Investments in Certain Entities That Calculate Net Asset Value per Share (or Its Equivalent).” This amendment removes the requirement to categorize within the fair value hierarchy all investments for which fair value is measured using the net asset value per share. This guidance will be effective for the Company in the fiscal year ending January 28, 2017. The implementation of this amendment will have an effect on the Company’s Notes to the Consolidated Financial Statements and will not have an effect on the Company’s Consolidated Statements of Operations or Consolidated Balance Sheets.
A-74
In September 2015, the FASB issued ASU 2015-16, “Business Combinations (Topic 805): Simplifying the Accounting for Measurement-Period Adjustments.” This amendment eliminates the requirement to retrospectively account for adjustments made to provisional amounts recognized in a business combination. This guidance will be effective for the Company in its fiscal year ending January 28, 2017. The implementation of this amendment is not expected to have a significant effect on the Company’s Consolidated Financial Statements.
In November 2015, the FASB issued ASU 2015-17, “Income Taxes (Topic 740): Balance Sheet Classification of Deferred Taxes.” This amendment requires deferred tax liabilities and assets be classified as noncurrent in a classified statement of financial position. This guidance will be effective for the fiscal year ending January 28, 2017. Early adoption is permitted. The implementation of this amendment will not have an effect on the Company’s Consolidated Statements of Operations and will not have a significant effect on the Company’s Consolidated Balance Sheets.
In February 2016, the FASB issued ASU 2016-02, “Leases”, which provides guidance for the recognition of lease agreements. The standard’s core principle is that a company will now recognize most leases on its balance sheet as lease liabilities with corresponding right-of-use assets. This guidance will be effective in the first quarter of fiscal year ending February 1, 2020. Early adoption is permitted currently. The adoption of this ASU will result in a significant increase to the Company’s balance sheet for lease liabilities and right-of-use assets, and the Company is currently evaluating the other effects of adoption of this ASU on its Consolidated Financial Statements.
19. Quarterly Data (Unaudited)
The two tables that follow reflect the unaudited results of operations for 2015 and 2014.
| Quarter | ||||||||||||||||||||||||||
| First | Second | Third | Fourth | Total Year | ||||||||||||||||||||||
| 2015 | (16 Weeks) | (12 Weeks) | (12 Weeks) | (12 Weeks) | (52 Weeks) | |||||||||||||||||||||
| Sales | $ | 33,051 | $ | 25,539 | $ | 25,075 | $ | 26,165 | $ | 109,830 | ||||||||||||||||
| Merchandise costs, including advertising, | ||||||||||||||||||||||||||
| warehousing, and transportation, excluding | ||||||||||||||||||||||||||
| items shown separately below | 25,760 | 20,065 | 19,478 | 20,193 | 85,496 | |||||||||||||||||||||
| Operating, general and administrative | 5,354 | 4,068 | 4,169 | 4,355 | 17,946 | |||||||||||||||||||||
| Rent | 215 | 155 | 172 | 181 | 723 | |||||||||||||||||||||
| Depreciation and amortization | 620 | 477 | 484 | 508 | 2,089 | |||||||||||||||||||||
| Operating profit | 1,102 | 774 | 772 | 928 | 3,576 | |||||||||||||||||||||
| Interest expense | 148 | 114 | 107 | 113 | 482 | |||||||||||||||||||||
| Earnings before income tax expense | 954 | 660 | 665 | 815 | 3,094 | |||||||||||||||||||||
| Income tax expense | 330 | 227 | 238 | 250 | 1,045 | |||||||||||||||||||||
| Net earnings including noncontrolling interests | 624 | 433 | 427 | 565 | 2,049 | |||||||||||||||||||||
| Net earnings (loss) attributable to | ||||||||||||||||||||||||||
| noncontrolling interests | 5 | — | (1 | ) | 6 | 10 | ||||||||||||||||||||
| Net earnings attributable to The Kroger Co. | $ | 619 | $ | 433 | $ | 428 | $ | 559 | $ | 2,039 | ||||||||||||||||
| Net earnings attributable to The Kroger Co. per | ||||||||||||||||||||||||||
| basic common share | $ | 0.63 | $ | 0.44 | $ | 0.44 | $ | 0.57 | $ | 2.09 | ||||||||||||||||
| Average number of shares used | ||||||||||||||||||||||||||
| in basic calculation | 969 | 963 | 965 | 966 | 966 | |||||||||||||||||||||
| Net earnings attributable to The Kroger Co. | ||||||||||||||||||||||||||
| per diluted common share | $ | 0.62 | $ | 0.44 | $ | 0.43 | $ | 0.57 | $ | 2.06 | ||||||||||||||||
| Average number of shares used in | ||||||||||||||||||||||||||
| diluted calculation | 983 | 977 | 979 | 980 | 980 | |||||||||||||||||||||
| Dividends declared per common share | $ | 0.093 | $ | 0.105 | $ | 0.105 | $ | 0.105 | $ | 0.408 | ||||||||||||||||
Annual amounts may not sum due to rounding.
In the third quarter of 2015, the Company incurred a $80 charge to OG&A expenses for contributions to the UFCW Consolidated Pension Plan.
A-75
In the fourth quarter of 2015, the Company incurred a $30 charge to OG&A expenses for contributions to the UFCW Consolidated Pension Plan.
| Quarter | |||||||||||||||||||||||||
| First | Second | Third | Fourth | Total Year | |||||||||||||||||||||
| 2014 | (16 Weeks) | (12 Weeks) | (12 Weeks) | (12 Weeks) | (52 Weeks) | ||||||||||||||||||||
| Sales | $ | 32,961 | $ | 25,310 | $ | 24,987 | $ | 25,207 | $ | 108,465 | |||||||||||||||
| Merchandise costs, including advertising, | |||||||||||||||||||||||||
| warehousing, and transportation, excluding | |||||||||||||||||||||||||
| items shown separately below | 26,065 | 20,136 | 19,764 | 19,547 | 85,512 | ||||||||||||||||||||
| Operating, general and administrative | 5,168 | 3,920 | 3,954 | 4,119 | 17,161 | ||||||||||||||||||||
| Rent | 217 | 166 | 162 | 162 | 707 | ||||||||||||||||||||
| Depreciation and amortization | 581 | 444 | 456 | 467 | 1,948 | ||||||||||||||||||||
| Operating profit | 930 | 644 | 651 | 912 | 3,137 | ||||||||||||||||||||
| Interest expense | 147 | 112 | 114 | 115 | 488 | ||||||||||||||||||||
| Earnings before income tax expense | 783 | 532 | 537 | 797 | 2,649 | ||||||||||||||||||||
| Income tax expense | 274 | 182 | 172 | 274 | 902 | ||||||||||||||||||||
| Net earnings including noncontrolling interests | 509 | 350 | 365 | 523 | 1,747 | ||||||||||||||||||||
| Net earnings attributable to | |||||||||||||||||||||||||
| noncontrolling interests | 8 | 3 | 3 | 5 | 19 | ||||||||||||||||||||
| Net earnings attributable to The Kroger Co. | $ | 501 | $ | 347 | $ | 362 | $ | 518 | $ | 1,728 | |||||||||||||||
| Net earnings attributable to The Kroger Co. | |||||||||||||||||||||||||
| per basic common share | $ | 0.50 | $ | 0.35 | $ | 0.37 | $ | 0.53 | $ | 1.74 | |||||||||||||||
| Average number of shares used in | |||||||||||||||||||||||||
| basic calculation | 1,002 | 970 | 972 | 972 | 981 | ||||||||||||||||||||
| Net earnings attributable to The Kroger Co. | |||||||||||||||||||||||||
| per diluted common share | $ | 0.49 | $ | 0.35 | $ | 0.36 | $ | 0.52 | $ | 1.72 | |||||||||||||||
| Average number of shares used in diluted | |||||||||||||||||||||||||
| calculation | 1,014 | 982 | 984 | 987 | 993 | ||||||||||||||||||||
| Dividends declared per common share | $ | 0.083 | $ | 0.083 | $ | 0.093 | $ | 0.093 | $ | 0.350 | |||||||||||||||
Annual amounts may not sum due to rounding.
In the first quarter of 2014, the Company incurred a $87 charge to OG&A expenses due to commitments and withdrawal liabilities arising from restructuring of certain pension plan agreements to help stabilize associates’ future benefits.
In the third quarter of 2014, the Company incurred a $25 charge to OG&A expenses due to contributions to the Company’s charitable foundation and a $17 benefit to income tax expense due to certain tax items.
In the fourth quarter of 2014, the Company incurred a $60 charge to OG&A expenses due to contributions to the Company’s charitable foundation and a $55 charge to OG&A expenses for contributions to the UFCW Consolidated Pension Plan.
20. Subsequent Event
In anticipation of future debt refinancing in fiscal years 2017 and 2018, the Company, in the first quarter of 2016, entered into additional forward-starting interest rate swap agreements with an aggregate notional amount totaling $1,300. After entering into these additional forward-starting interest rate swaps, the Company has a total of $1,700 notional amount of forward-starting interest rate swaps outstanding. The forward-starting interest rate swaps entered into in the first quarter of 2016 were designated as cash-flow hedges as defined by GAAP.
A-76
VOTE BY INTERNET -www.proxyvote.comUse the Internet to transmit your voting instructions and for electronic delivery of information up until 11:59 P.M. Eastern Time the day before the meeting date. Have your proxy card in hand when you access the web site and follow the instructions to obtain your records and to create an electronic voting instruction form.
ELECTRONIC DELIVERY OF FUTURE PROXY MATERIALSIf you would like to reduce the costs incurred byour companyin mailing proxy materials, you can consent to receiving all future proxy statements, proxy cards and annual reports electronically via e-mail or the Internet. To sign up for electronic delivery, please follow the instructions above to vote using the Internet and, when prompted, indicate that you agree to receive or access proxy materials electronically in future years.
VOTE BY PHONE - 1-800-690-6903Use any touch-tone telephone to transmit your voting instructions up until 11:59 P.M. Eastern Time the day before the meeting date. Have your proxy card in hand when you call and then follow the instructions.
VOTE BY MAILMark, sign and date your proxy card and return it in the postage-paid envelope we have provided or return it to Vote Processing, c/o Broadridge, 51 Mercedes Way, Edgewood, NY 11717. If you vote your proxy by Internet or by telephone, you do NOT need to mail back your proxy card.
| TO VOTE, MARK BLOCKS BELOW IN BLUE OR BLACK INK AS FOLLOWS: | ||||||
| E47733-P09449 | KEEP THIS PORTION FOR YOUR RECORDS | |||||
— — — — — — — — — — — — — — — — — — — — — — — — — — — — — — — — — — — — — — — — — — — — — —
| DETACH AND RETURN THIS PORTION ONLY | ||||
THIS PROXY CARD IS VALID ONLY WHEN SIGNED AND DATED. | ||||
THE KROGER CO. | ||||||||||||||||||||||||||||||||
The Board of Directors recommends you vote FOR the following: | ||||||||||||||||||||||||||||||||
1. | Election of Directors | |||||||||||||||||||||||||||||||
Nominees: | ||||||||||||||||||||||||||||||||
| For | Against | Abstain | ||||||||||||||||||||||||||||||
1a. Nora A. Aufreiter | ||||||||||||||||||||||||||||||||
☐ | ||||||||||||||||||||||||||||||||
☐ | ||||||||||||||||||||||||||||||||
☐ | ||||||||||||||||||||||||||||||||
The Board of Directors recommends that you vote FOR proposals 2, 3, 4 and | For | Against | Abstain | |||||||||||||||||||||||||||||
1b. Robert D. Beyer | ☐ | �� | ☐ | ☐ | 2. | Approval, on an advisory basis, of Kroger’s executive compensation. | ☐ ☐ | ☐ ☐ | ☐ ☐ | |||||||||||||||||||||||
1c. Anne Gates | ☐ | ☐ | ☐ | 3. | Approval of an amendment to Kroger’s Regulations to adopt proxy access. | |||||||||||||||||||||||||||
1d. Susan J. Kropf | ☐ | |||||||||||||||||||||||||||||||
☐ | ☐ | 4. | Approval of an amendment to Kroger’s Regulations to permit Board amendments in accordance with Ohio law. | ☐ | ☐ | ☐ | ||||||||||||||||||||||||||
1e. W. Rodney McMullen | ☐ | ☐ | ☐ | 5. | Ratification of PricewaterhouseCoopers LLP, as auditors. | ☐ | ☐ | ☐ | ||||||||||||||||||||||||
1f. Jorge P. Montoya | ||||||||||||||||||||||||||||||||
☐ | ☐ | ☐ | The Board of Directors recommends that you vote AGAINST proposals | For | Against | Abstain | ||||||||||||||||||||||||||
1g. Clyde R. Moore | ||||||||||||||||||||||||||||||||
☐ | ||||||||||||||||||||||||||||||||
☐ | ☐ | 6. | A shareholder proposal, if properly presented, to issue a report assessing the climate benefits and feasibility of adopting enterprise-wide, quantitative, time bound targets for increasing renewable energy sourcing. | ☐ | ☐ | ☐ | ||||||||||||||||||||||||||
1h. James A. Runde | ☐ | ☐ | ☐ | |||||||||||||||||||||||||||||
1i. Ronald L. Sargent | ☐ | ☐ | ☐ | 7. | A shareholder proposal, if properly presented, to issue a report providing quantitative metrics on supply chain impacts on deforestation, including progress on time bound goals for reducing such impacts. | ☐ | ☐ | ☐ | ||||||||||||||||||||||||
1j. Bobby S. Shackouls | ☐ | ☐ | ☐ | |||||||||||||||||||||||||||||
1k. Mark S. Sutton | ☐ | ☐ | ☐ | 8. | A shareholder proposal, if properly presented, to adopt a | ☐ | ☐ | ☐ | ||||||||||||||||||||||||
NOTE:Holders of common shares of record at the close of business on | ||||||||||||||||||||||||||||||||
Please sign exactly as your name(s) appear(s) hereon. When signing as attorney, executor, administrator, or other fiduciary, please give full title as such. Joint owners should each sign personally. All holders must sign. If a corporation or partnership, please sign in full corporate or partnership name by authorized officer.
| ||||||||||||||||||||||||||||||||
| | ||||||||||||||||||||||||||||||||
| Signature [PLEASE SIGN WITHIN BOX] | Date | Signature (Joint Owners) | Date | |||||||||||||||||||||||||||||
Important Notice Regarding the Availability of Proxy Materials for the Annual Meeting:
The Combined Notice, Proxy Statement, and Annual Report are available atwww.proxyvote.com.www.proxyvote.com.
— — — — — — — — — — — — — — — — — — — — — — — — — — — — — — — — — — — — — — — — — — — — — —
E47734-P09449
THE KROGER CO. 2018 Annual Meeting of Shareholders June 28, 2018 11:00 AM Eastern Time This proxy is solicited by the Board of Directors | ||||||||||||||||||||||||
The undersigned hereby appoints each of ROBERT D. BEYER, W. RODNEY McMULLEN, and RONALD L. SARGENT, or if more than one is present and acting then a majority thereof, proxies, with full power of substitution and revocation, to vote the common shares of The Kroger Co. that the undersigned is entitled to vote at the annual meeting of shareholders, and at any adjournment thereof, with all the powers the undersigned would possess if personally present, including authority to vote on the matters shown on the reverse in the manner directed, and upon any other matter that properly may come before the meeting. The undersigned hereby revokes any proxy previously given to vote those shares at the meeting or at any adjournment. The proxies are directed to vote as specified on the reverse hereof and in their discretion on all other matters coming before the meeting. Except as specified to the contrary on the reverse, the shares represented by this proxy will be voted FOR each nominee listed in Proposal 1, FOR Proposals 2, 3, 4 and 5, and AGAINST Proposals 6, 7 and 8. If you wish to vote in accordance with the recommendations of the Board of Directors, all you need to do is sign and return this card. The above named proxies cannot vote the shares unless you vote your proxy by Internet or telephone, or sign and return this card. Only shareholders and persons holding proxies from shareholders may attend the meeting.If you are attending the meeting, you must bring either: (1) the notice of the meeting that was separately mailed to you or (2) the top portion of your proxy card, either of which will be your admission ticket.You must also bring valid photo identification, such as a driver’s license or passport. We reserve the right to exclude any person who cannot provide an admission ticket and valid photo identification. YOUR MANAGEMENT DESIRES TO HAVE A LARGE NUMBER OF SHAREHOLDERS REPRESENTED AT THE MEETING, IN PERSON OR BY PROXY. PLEASE VOTE YOUR PROXY ELECTRONICALLY VIA THE INTERNET OR BY TELEPHONE. IF YOU HAVE ELECTED TO RECEIVE PRINTED MATERIALS, YOU MAY SIGN AND DATE THE PROXY AND MAIL IT IN THE SELF-ADDRESSED ENVELOPE PROVIDED. NO POSTAGE IS REQUIRED IF MAILED WITHIN THE UNITED STATES. If you are unable to attend the annual meeting, you may listen to a live webcast of the meeting, which will be accessible through our website, ir.kroger.com, at 11:00 AM Eastern Time on June 28, 2018. | ||||||||||||||||||||||||
Continued and to be signed on reverse side | ||||||||||||||||||||||||
THE KROGER CO.2016 Annual Meeting of ShareholdersJune 23, 2016 11:00 AM Eastern TimeThis proxy is solicited by the Board of Directors
The undersigned hereby appoints each of ROBERT D. BEYER, W. RODNEY McMULLEN, and RONALD L. SARGENT, or if more than one is present and acting then a majority thereof, proxies, with full power of substitution and revocation, to vote the common shares of The Kroger Co. that the undersigned is entitled to vote at the annual meeting of shareholders, and at any adjournment thereof, with all the powers the undersigned would possess if personally present, including authority to vote on the matters shown on the reverse in the manner directed, and upon any other matter that properly may come before the meeting. The undersigned hereby revokes any proxy previously given to vote those shares at the meeting or at any adjournment.
The proxies are directed to vote as specified on the reverse hereof and in their discretion on all other matters coming before the meeting. Except as specified to the contrary on the reverse, the shares represented by this proxy will be voted FOR each nominee listed in Proposal 1, FOR Proposals 2 and 3, and AGAINST Proposals 4, 5, 6 and 7.
If you wish to vote in accordance with the recommendations of the Board of Directors, all you need to do is sign and return this card. The above named proxies cannot vote the shares unless you vote your proxy by Internet or telephone, or sign and return this card.
Only shareholders and persons holding proxies from shareholders may attend the meeting.If you are attending the meeting, you must bring either: (1) the notice of the meeting that was separately mailed to you or (2) the top portion of your proxy card, either of which will be your admission ticket.
YOUR MANAGEMENT DESIRES TO HAVE A LARGE NUMBER OF SHAREHOLDERS REPRESENTED AT THE MEETING, IN PERSON OR BY PROXY. PLEASE VOTE YOUR PROXY ELECTRONICALLY VIA THE INTERNET OR BY TELEPHONE. IF YOU HAVE ELECTED TO RECEIVE PRINTED MATERIALS, YOU MAY SIGN AND DATE THE PROXY AND MAIL IT IN THE SELF-ADDRESSED ENVELOPE PROVIDED. NO POSTAGE IS REQUIRED IF MAILED WITHIN THE UNITED STATES. If you are unable to attend the annual meeting, you may listen to a live webcast of the meeting, which will be accessible through our website, ir.kroger.com, at 11:00 AM Eastern Time on June 23, 2016.
Continued and to be signed on reverse side